Search results
Create the page "Sea level" on this wiki! See also the search results found.
Page title matches
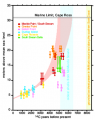
File:Figure 3.16 - Relative sea level curve for the Ross Sea based on radiocarbon dates.png ...2003">Hall, B.L., Baroni, C. and Denton, G.H. 2003. Holocene relative sea-level history of the southern Victoria Land coast, Antarctica, ''Global and Plane(386 × 488 (87 KB)) - 15:30, 6 August 2014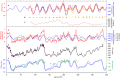
File:Figure 3.10 - Accurately dated Antarctic ice-core records and the comparison with sea level proxies.png ...J.C., McManus, J.F., Lambeck, K., Balbon, E. and Labracherie, M. 2002. Sea level and deep water temperature changes derived from bentic foraminifera isotopi(611 × 396 (118 KB)) - 15:30, 6 August 2014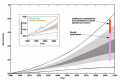
File:Figure 5.19 - Projected sea-level rise for the Twenty First Century.png ...e for the Twenty First Century. The projected range of global averaged sea-level rise from the IPCC 2001 Assessment Report for the period 1990 to 2100 is sh(532 × 353 (134 KB)) - 15:31, 6 August 2014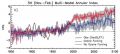
File:Figure 5.5 - Mean regression of the leading EOF of ensemble mean SH sea level pressure.png .... The grey shading represents the inter-model spread at the 95% confidence level and is filtered. A filtered version of the observed SLP from the Hadley Cen(542 × 244 (146 KB)) - 15:31, 6 August 2014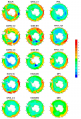
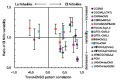
File:Figure 5.20 - Regional sea level rise projections in 2100 under SRESA1B relative to the global mean.png ..., Domingues, C.M., Hunter, J.R. and Lambeck, K. 2008. Understanding global sea levels: past, present and future, ''Sustainability Science'', '''3''', 9-22(459 × 675 (274 KB)) - 15:31, 6 August 2014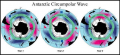
File:Figure 4.5 - Schematic summary of interannual variations in SST, sea level pressure and sea ice extent.png ...An Antarctic Circumpolar Wave in surface pressure, wind, temperature, and sea ice extent, ''Nature'', '''380''', 699-702.</ref>).(554 × 254 (220 KB)) - 15:31, 6 August 2014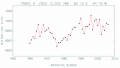
File:Figure 4.45 - PSMSL Argentine Islands Revised Local Reference (RLR) annual mean sea level time series.png PSMSL Revised Local Reference (RLR) annual mean sea level time series for Vernadsky/Faraday (called Argentine Islands in the PSMSL da(474 × 269 (17 KB)) - 15:31, 6 August 2014- The two major reasons for sea-level rise are expansion of ocean waters as they warm (and an associated decrease ...e for the Twenty First Century. The projected range of global averaged sea-level rise from the IPCC 2001 Assessment Report for the period 1990 to 2100 is sh16 KB (2,491 words) - 13:16, 22 August 2014
- ...LGM (Huybrechts, 2002<ref name="Huybrechts, 2002">Huybrechts, P. 2002. Sea-level changes at the LGM from ice-dynamic reconstructions of the Greenland and An ...he eustatic contribution and so there is a continuous fall in relative sea level like that seen in areas such as Hudson Bay or Sweden today.21 KB (3,294 words) - 15:33, 6 August 2014
- .../ref>). However, it should be noted that the Antarctic contribution to sea level now is small compared to what it was following the LGM Transition and throu ...L. and Unnikrishnan, A. 2007. Observations: oceanic climate change and sea level. In Climate Change 2007: The Physical Science Basis. Contribution of Workin8 KB (1,342 words) - 15:33, 6 August 2014
- ==Monitoring sea level== ...ally hostile areas to the same standard as is possible elsewhere. Most sea level measurements during the 19<sup>th</sup> and 20<sup>th</sup> centuries were11 KB (1,784 words) - 15:33, 6 August 2014


_annual_mean_sea_level_time_series.png)
Page text matches
File:Figure 5.4 - Change in average tropical Pacific SSTs and El Nino variability simulated by AOGCMs.png ...is denoted by the ratio of the standard deviation of the first EOF of sea level pressure (SLP) between the current climate and the last 50 years of the IPC(468 × 316 (70 KB)) - 15:30, 6 August 2014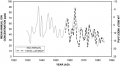
File:Figure 2.6 - Nitrate concentration at GD09 and JJA Macquarie Island-Scott Base MSLP gradient.png ...eastern Wilkes Land, East Antarctica) plotted against the average mean sea level pressure (MSLP) gradient between Macquarie Island and Scott Base for June,(497 × 274 (47 KB)) - 15:30, 6 August 2014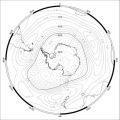
File:Figure 4.1 - Austral summer gridded 500hPa geopotential height monthly anomalies for 1989-2008.png ...he 500 hPa surface is approximately at an elevation of 5 km above mean sea level) for 1989-2008. Here the SAM is in its positive phase with negative anomali(363 × 363 (106 KB)) - 15:30, 6 August 2014File:Figure 3.16 - Relative sea level curve for the Ross Sea based on radiocarbon dates.png ...2003">Hall, B.L., Baroni, C. and Denton, G.H. 2003. Holocene relative sea-level history of the southern Victoria Land coast, Antarctica, ''Global and Plane(386 × 488 (87 KB)) - 15:30, 6 August 2014File:Figure 3.10 - Accurately dated Antarctic ice-core records and the comparison with sea level proxies.png ...J.C., McManus, J.F., Lambeck, K., Balbon, E. and Labracherie, M. 2002. Sea level and deep water temperature changes derived from bentic foraminifera isotopi(611 × 396 (118 KB)) - 15:30, 6 August 2014File:Figure 5.19 - Projected sea-level rise for the Twenty First Century.png ...e for the Twenty First Century. The projected range of global averaged sea-level rise from the IPCC 2001 Assessment Report for the period 1990 to 2100 is sh(532 × 353 (134 KB)) - 15:31, 6 August 2014File:Figure 5.5 - Mean regression of the leading EOF of ensemble mean SH sea level pressure.png .... The grey shading represents the inter-model spread at the 95% confidence level and is filtered. A filtered version of the observed SLP from the Hadley Cen(542 × 244 (146 KB)) - 15:31, 6 August 2014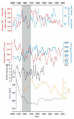
File:Figure 3.20 - Signals of climate change in ice core records from Siple Dome and Law Dome.png ...n Sea Low) and EAH (East Antarctic High), respectively, with estimated sea level pressure developed from calibration with the instrumental and NCEP reanalys(436 × 702 (289 KB)) - 15:31, 6 August 2014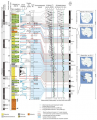
File:Figure 3.8 - Lithological column for the upper 600m of the AND-1B drillcore.png ...001071.</ref>) and the modelled contribution of Antarctic Ice Sheet to sea level change for the last 5 million years (Pollard and DeConto, 2009<ref name="Po(562 × 694 (486 KB)) - 15:31, 6 August 2014File:Figure 5.20 - Regional sea level rise projections in 2100 under SRESA1B relative to the global mean.png ..., Domingues, C.M., Hunter, J.R. and Lambeck, K. 2008. Understanding global sea levels: past, present and future, ''Sustainability Science'', '''3''', 9-22(459 × 675 (274 KB)) - 15:31, 6 August 2014File:Figure 4.5 - Schematic summary of interannual variations in SST, sea level pressure and sea ice extent.png ...An Antarctic Circumpolar Wave in surface pressure, wind, temperature, and sea ice extent, ''Nature'', '''380''', 699-702.</ref>).(554 × 254 (220 KB)) - 15:31, 6 August 2014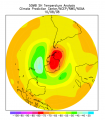
File:Figure 1.13 - The Antarctic polar vortex in mid-winter.png ...s C on the 50 hPa pressure surface (roughly 20 km elevation above mean sea level). Generated from the NCEP reanalysis using their online, interactive chart(551 × 628 (189 KB)) - 15:31, 6 August 2014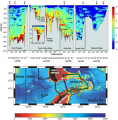
File:Figure 4.28 - Vertical distribution of turbulent diapycnal diffusivity along the rim of the Scotia Sea.png ...asured (top), is displayed along a section following the rim of the Scotia Sea anticlockwise (green dots on the bottom graph). Density surfaces separating(536 × 543 (332 KB)) - 15:31, 6 August 2014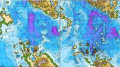
File:Figure 2.33 - Bed elevations of the Amundsen Sea Embayment.png ...below sea level, with deeper blue signifying greater depths. The Amundsen Sea is in the lower left corner. Comparison shows that the recent surveys provi(447 × 250 (342 KB)) - 15:31, 6 August 2014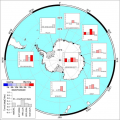
File:Figure 4.10 - Annual and seasonal 500hPa temperature trends for 1971-2003.png Annual and seasonal 500 hPa (approximately at 5 km above mean sea level) temperature trends for 1971-2003. From Turner et al. (2006<ref name="Turne(553 × 553 (271 KB)) - 15:31, 6 August 2014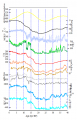
File:Figure 3.14 - Climate and environmental records of Termination I.png ...bach, D., Barbante, C., Gabrielli, P. and Gaspari, V. 2006. Southern Ocean sea-ice extent, productivity and iron flux over the past eight glacial cycles,(418 × 649 (125 KB)) - 15:31, 6 August 2014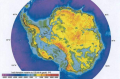
File:Figure 1.4 - Antarctic bed elevation.png Bed elevation illustrating major regions (in blue and green) below sea level, the major subglacial continent underneath East Antarctica, and the mountai(628 × 413 (414 KB)) - 15:31, 6 August 2014File:Figure 4.45 - PSMSL Argentine Islands Revised Local Reference (RLR) annual mean sea level time series.png PSMSL Revised Local Reference (RLR) annual mean sea level time series for Vernadsky/Faraday (called Argentine Islands in the PSMSL da(474 × 269 (17 KB)) - 15:31, 6 August 2014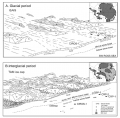
File:Figure 3.7 - View of the Victoria Land coast off Cape Roberts during Oligocene and early Miocene times.png ...name="DeConto et al, 2007">Deconto, R., Pollard, D. and Harwood, D. 2007. Sea ice feedback and Cenozoic evolution of Antarctic climate and ice sheets, Pa(479 × 471 (169 KB)) - 15:31, 6 August 2014- The two major reasons for sea-level rise are expansion of ocean waters as they warm (and an associated decrease ...e for the Twenty First Century. The projected range of global averaged sea-level rise from the IPCC 2001 Assessment Report for the period 1990 to 2100 is sh16 KB (2,491 words) - 13:16, 22 August 2014
- ...meteorological conditions across the Southern Ocean, ocean conditions, the sea ice extent and the terrestrial and marine biology. ...rface of the ocean, but not the layers below. Even here quantities such as sea ice extent have only been monitored since the late 1970s, when microwave te3 KB (501 words) - 16:48, 6 August 2014
- ...r both scientists and policymakers concerned with issues as diverse as sea-level rise and fish stocks. A major problem is that we still have a poor understa ...tions for temperature and precipitation were used to estimate how much sea level would rise under various greenhouse gas emission scenarios. In the followin5 KB (788 words) - 16:49, 6 August 2014
- ...heet and its effects on global sea level, and the changing distribution of sea ice and its effect on climate are then described. ...n results from the interactions within the ice sheet – ocean – sea ice – atmosphere system. Knowledge of how this system responds to pas17 KB (2,554 words) - 16:45, 6 August 2014
- ##[[Sea ice observations]] ##[[Sea level observations]]4 KB (504 words) - 17:51, 21 August 2014
- ...LGM (Huybrechts, 2002<ref name="Huybrechts, 2002">Huybrechts, P. 2002. Sea-level changes at the LGM from ice-dynamic reconstructions of the Greenland and An ...he eustatic contribution and so there is a continuous fall in relative sea level like that seen in areas such as Hudson Bay or Sweden today.21 KB (3,294 words) - 15:33, 6 August 2014
- ...f the tropopause varies with latitude and is roughly at 8 km above hand or sea in the polar regions. The troposphere itself is nominally subdivided into l ...lt measured in ice cores might provide a proxy for assessing the extent of sea ice and how this varied under different climatic conditions. The records of43 KB (6,788 words) - 17:07, 22 August 2014
- ...he 500 hPa surface is approximately at an elevation of 5 km above mean sea level) for 1989-2008. Here the SAM is in its positive phase with negative anomali ...Loon, 1982">Rogers, J.C. and Van Loon, H. 1982. Spatial Variability of Sea Level Pressure and 500 mb Height Anomalies over the Southern Hemisphere, ''Mon. W54 KB (8,177 words) - 13:38, 22 August 2014
- ...circulation in the warming of the Antarctic Peninsula, the distribution of sea ice, and the seasonal to interannual variability of the Southern Hemisphere ...re, ''Tellus'', '''46A''', 325-338.</ref>). More recently, analyses of sea level pressure have revealed secular decreases over the Antarctic, associated wit29 KB (4,462 words) - 17:11, 22 August 2014
- ...is increases their discharge of ice into the ocean, and contributes to sea level rise. ...o test such models. To attribute the glaciological changes in the Amundsen Sea sector to a particular climate forcing will require a better understanding13 KB (1,943 words) - 15:33, 6 August 2014
- ...g on individual physiology and behaviour is important, because that is the level at which natural selection works, and other responses ultimately depend on ...h changes in gene frequencies between generations, which at the population level is known as microevolution. Changes in gene frequencies are irreversible an16 KB (2,488 words) - 15:33, 6 August 2014
- ...wfall fluctuations of +/-20 mm/yr weq, i.e., +/-0.69 mm/yr GSL (global sea level) equivalent, are common (Monaghan et al., 2006a<ref name="Monaghan et al, 2 ...he Greenland and Antarctic ice sheets and shelves and contributions to sea-level rise: 1992-2002, ''Journal of Glaciology'', '''51'''(175), 509-527.</ref>)20 KB (3,125 words) - 15:33, 6 August 2014
- ...hange it will be essential to use proxy records to represent how Antarctic sea ice has changed in the past. ...., Pichon, J.J. and Burckle, L.H. 1998b. Reappraisal of Antarctic seasonal sea-ice at the Last Glacial Maximum, ''Geophysical Research Letters'', '''25'''24 KB (3,785 words) - 17:17, 22 August 2014
- ...rdm; warmer than pre-industrial levels. The data also demonstrate that sea-level change, and therefore the rate of ice loss, will be neither uniform nor mon ...snowfall was included, and was highly significant. Without its effect, sea level rise projections would generally be 5 cm higher.26 KB (4,124 words) - 14:04, 22 August 2014
- ...example is the occurrence of a later Holocene climate optimum in the Ross Sea which is in phase with a marked cooling observed in ice cores from coastal ...heet extent, including submarine surveys, and records of past relative sea level change. New biological evidence of floras that have survived through glacia7 KB (1,082 words) - 15:33, 6 August 2014
- ...ctic ice sheet, the current state of the ocean is influencing the Amundsen Sea sector of West Antarctica and is likely also responsible for similarly beha ..., these events heighten concern about the near-future impact on global sea level of change in much larger ice reservoirs.3 KB (475 words) - 15:33, 6 August 2014
- ...n the most sensitive of the Antarctic ice sheets to climate change and sea level rise (Domack et al., 2003a<ref name="Domack et al, 2003a">Domack, E., Leven ...al shelf edge, based on an ice surface profile reconstructed from the Ross Sea (Stuiver et al., 1981<ref name="Stuiver et al, 1981">Stuiver, M., Denton, G22 KB (3,430 words) - 13:03, 22 August 2014
- ...e. He has undertaken 13 expeditions at Mario Zucchelli Station in the Ross Sea, and 6 at Palmer Station on the Antarctic Peninsula, and participated in 3 ...in the past. Recent career highlights include developing new relative sea level curves for Antarctica, reconstructing the Holocene history of Antarctic Pen7 KB (1,089 words) - 15:33, 6 August 2014
- ...tudies and models of the circulation of the Southern Ocean and the role of sea ice. These observations are also hoping to contribute to improved character ...emain the same as before – to measure ice thickness on both land and sea very precisely so as to provide conclusive proof as to whether there is a t7 KB (1,040 words) - 16:16, 22 August 2014
- ...J.C., McManus, J.F., Lambeck, K., Balbon, E. and Labracherie, M. 2002. Sea level and deep water temperature changes derived from bentic foraminifera isotopi ...deep water formation, gas exchange due to a decreasing sea ice cover, sea level rise and rising terrestrial carbon storage. Other models have identified th35 KB (5,415 words) - 15:33, 6 August 2014
- ...Hultzsch, N., Melles, M. and Gore, D.B. 2007. Indications of Holocene sea-level rise in Beaver Lake, East Antarctica, Cambridge Journals Online, 125-128.</ ...93<ref name="Goodwin, 1993">Goodwin, I.D. 1993. Holocene deglaciation, sea-level change, and the emergence of the Windmill Islands, Budd Coast, Antarctica,38 KB (5,787 words) - 17:39, 22 August 2014
- ...of Antarctic Ice at the Last Glacial Maximum, and its impact on global sea level change, ''Quaternary Science Reviews'', '''18''', 1569-1595.</ref>; Ing&oac ...entley, M.J., Hodgson, D.A., Smith, J.A. and Cox, N.J. 2005a. Relative sea level curves for the South Shetland Islands and Marguerite Bay, Antarctic Peninsu32 KB (5,127 words) - 17:41, 22 August 2014
- ....png|thumb|'''3.28''' Selected Holocene environmental changes – Ross Sea]] ...432.</ref>); the evaporation of Lake Washburn started during the LGM. Lake level lowering was discontinuous, with a series of high and low stands (Wagner et17 KB (2,705 words) - 17:43, 22 August 2014
- ...ce Sheets, ed. G. Denton and T. Hughes, 67-178.</ref>) and retreat of Ross Sea Ice Sheet (Conway et al., 1999<ref name="Conway et al, 1999">Conway, H., Ha ...wing location of GISP2, Siple Dome, Icelandic Low, Siberian High, Amundsen Sea Low, Intertropical Convergence Zone, and westerlies in both hemispheres.]]39 KB (5,945 words) - 15:33, 6 August 2014
- ...West Antarctic Ice Sheet may be on the verge of contributing to future sea level rise, and have reinvigorated the long-standing debate about the stability o ...ice sheet models cannot be used with confidence for assessing expected sea level change until they demonstrate realistic forcing yielding realistic rates of33 KB (5,053 words) - 15:33, 6 August 2014
- ...ns in the Ocean-Ocean Processes and Marine Population Dynamics. California Sea Grant College System, La Jolla.</ref>; Finney et al., 2002<ref name="Finney ...relevance of oxygen limited heat tolerance through its effect at ecosystem level (Pörtner and Knust, 2007<ref name="Pörtner and Knust, 2007">P&oum25 KB (3,817 words) - 15:33, 6 August 2014
- ...r, conducting research in the Southern Ocean can be extremely challenging. Sea ice, high winds, rough seas, poor visibility, sub-zero temperatures, 24 hou ...er to examine its properties or by catching and examining animals from the sea has been carried out to some extent since humans first took to the oceans.17 KB (2,672 words) - 15:50, 6 August 2014
- ...nt will increase by several degrees and there will be about one third less sea ice.</li> ...pre-industrial values, CO<sub>2</sub> values may have reached 400 ppm, and sea levels were 15-25 m above today’s.</li>48 KB (7,673 words) - 18:27, 22 August 2014
- ...ures across the continent are projected to increase by several degrees and sea ice will be reduced by about one third.</li> ...re-industrial values, CO<sub>2</sub> values may have reached ~400 ppm, and sea levels were 15-25 m above today’s. There is evidence for Pliocene WAI142 KB (22,142 words) - 16:25, 6 August 2014
- .../ref>). However, it should be noted that the Antarctic contribution to sea level now is small compared to what it was following the LGM Transition and throu ...L. and Unnikrishnan, A. 2007. Observations: oceanic climate change and sea level. In Climate Change 2007: The Physical Science Basis. Contribution of Workin8 KB (1,342 words) - 15:33, 6 August 2014
- ...ern Ocean shallow water marine fauna is to what degree fluctuations in sea level, and the extent of the continental ice-sheet, have driven changes in the de ...ile suspension feeders with archaic features in the high-Antarctic, ''Deep-Sea Res. II'', '''53''', 1029-1052.</ref>) and reminds regionally due to its 3-54 KB (8,173 words) - 15:33, 6 August 2014


