Antarctic and Southern Ocean sea level projections
- This page is part of the topic Antarctic climate and environment change over the next 100 years
The two major reasons for sea-level rise are expansion of ocean waters as they warm (and an associated decrease in ocean density) and an increase in the ocean mass, principally by melting of land-based sources of ice (glaciers and ice caps and the ice sheets of Greenland and Antarctica). The amount of thermal expansion is non-uniform due to the influence of ocean currents and spatial variations in ocean warming. Global warming from increasing greenhouse gas concentrations is a significant driver of both contributions.

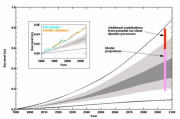
The IPCC provides the most authoritative information on projected sea-level change. The IPCC Third Assessment Report (TAR) (Church et al., 2001[1]) projected a global averaged sea-level rise ranging from 9 to 88 cm between 1990 and 2100 using the full range of IPCC greenhouse gas scenarios, a range of climate models and an additional uncertainty for land-ice changes. For the IPCC’s Fourth Assessment Report (IPCC, 2007[2]), the range of sea-level projections, using a larger range of models, was 18 to 59 cm (with 90% confidence limits) over the period from 1980-1999 to 2090-2099 (Meehl et al., 2007[3]). This rise in sea level is mainly a result of thermal expansion of the upper ocean and from glaciers and ice caps, with little contribution from Greenland and Antarctica. However, as mentioned earlier, ice sheet models are incomplete and do not allow for a rapid dynamic response of the ice sheets. To allow for ice sheet uncertainties, IPCC’s AR4 increased the upper limit of projected sea-level rise by 10 to 20 cm, stating that ‘larger values cannot be excluded, but understanding of these effects is too limited to assess their likelihood or provide a best estimate or an upper bound for sea-level rise.’ The end result is that the upper bound of the IPCC TAR and AR4 projections from 2001 and 2007 respectively are similar (Figure 5.19).
Since 1993, there have been high-quality satellite-altimeter observations of sea level over most of the globe (about 65°N to 65°S), allowing accurate estimates of both global-averaged and regional sea-level change. Global correlation patterns (empirical orthogonal functions) estimated from the satellite altimeter record have been combined with coastal and island tide-gauge data (corrected for glacial isostatic adjustment) to estimate global-averaged sea levels since 1870 (Church and White, 2006[4]). The results show that, from 1870 to the present, global sea level has risen by about 20 cm, at an average rate of 1.7 mm/yr during the Twentieth Century, with an increase in the rate of rise over this period (Figure 5.19). Jevrejeva et al. (2006[5]) and Holgate and Woodworth (2004[6]) have used quite different techniques of analyzing historical tide-gauge data and have found quite similar historical rates of sea-level rise. For the modern satellite period (since 1993), sea level has been rising more rapidly at an average rate of 3.1 mm/yr (IPCC, 2007[2]). The latest estimates of sea level rise, for 2003-2008, based on GRACE space gravimetry measurements, show that that rate of sea level rise has now slowed to 2.5 mm/yr (Cazenave et al., 2009[7]). Note that these rates of increase are an order of magnitude faster than the average rate of rise over the previous several thousand years, but significantly slower than the rates of rise at the end of the Last Glacial Maximum and at the end of the Younger Dryas event (see The transition to Holocene interglacial conditions and Antarctic deglaciation and its impact on global sea level).
About a third to a half of the sea-level rise during the first decade of the altimeter record can be attributed to thermal expansion due to a warming of the oceans; the other major contributions include the combined effects of melting glaciers and ice sheets. Changes in the storage of water on land (such as the depletion of aquifers and increases in dams and reservoirs) remain very uncertain.
Concern that the IPCC sea-level projections may be biased on the low side has been reinforced by the increase in the rate of rise of sea level since the early 1990s. The rate of 3.1 mm/yr noted in the IPCC (2007[2]) report is faster than the central range of the IPCC projections and at the very upper end of the IPCC projections (Rahmstorf et al, 2007[8]). This suggests that one or more of the model contributions to sea-level rise is underestimated (see inset diagram in Fig 5.19). Given these observations, Rahmstorf et al. (2007[8]) projected a likely maximum sea-level rise of 1.4 m by 2100. Future sea level increases projected by the IPCC (2007[2]) do not include possibly large contributions resulting from the dynamic instability of ice sheets during the Twenty First Century. Taking such variables into consideration, Pfeffer et al. (2008[9]) estimate an upper bound of 2 m of sea-level rise by 2100.
Sea-level projections to and beyond 2100 are critically dependent on future greenhouse gas emissions, with both ocean thermal expansion and the ice sheets potentially contributing metres over centuries for higher greenhouse gas emissions. There is widespread acceptance that at peak past interglacial global warmings of 2-3ºC above the temperature in 1900 led to rises of sea level of 4-6 m (e.g. see IPCC, 2007[2]; Gregory and Huybrechts, 2006[10]). We do not know enough about either modern processes or future rates to say how soon such rises in sea level might occur again (if at all), but they do not seem likely within the next few hundred years as far as we can tell from all that we know at present. Therefore the current target for mitigation should be a maximum of 2 m, with a likelihood of it being less.
Regional Projections of mean sea-level rise
Overlying the global sea-level rise is a large regional variability, and sea-level rise during the Twenty First Century is not expected to be uniform around the globe. This is a result of changing atmospheric conditions, particularly surface winds (Lowe et al., 2006[11]) and as a result of changes in ocean currents.
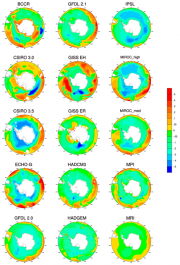
The strongest signatures of the spatial pattern of sea-level rise projections in the average of 16 coupled atmosphere-ocean models used for the IPCC AR4 are a minimum in sea-level rise in the Southern Ocean south of the Antarctic Circumpolar Current and a maximum in the Arctic Ocean. The next strongest features are maxima in sea-level rise at latitudes of about 30° to 40°N in the Pacific and to a lesser extent the Atlantic Ocean, and at about 40° to 50°S in all of the southern hemisphere oceans, at the poleward extremities of the subtropical gyres.
The minimum sea-level rise in the Southern Ocean is due to the thermal expansion coefficient being lower in cold waters than warmer waters. For instance if heat is added to the Southern Ocean region, the change in density and sea-level rise will be less than if the same amount of heat had been added in a warmer location (Lowe et al., 2006[11]).

Sixteen of the models used for the IPCC assessment are shown in Figure 5.20 using the mid-range A1B scenario (stabilization of CO2 equivalent at 720 ppm by 2100), following the approach of Church et al. (2008[12]). The models show relative sea- level rise. The global mean sea-level rise has been removed to reduce some of the impact on the results from different models having different climate sensitivities. All the models show the Southern Ocean region has reduced sea-level increases compared to the global average of 15-20 cm. Four of the models show that in the coastal region close to Antarctica there is a small increase in sea level above the average of 5-10 cm. It is possible that freshwater changes to the local density or changes to local current systems have given rise to the higher sea levels in these coastal regions. These regional changes need to be investigated further in the individual models before firm conclusions can be drawn.
Mid-latitude studies emphasize that extremes in sea level will increase in future as wind speeds and storm intensity increases. Less is known about storm surges in the Antarctic region, with only one study from the Ross Sea (Goring and Pyne, 2003[13]) and two from long records in the Falklands and South Georgia (Woodworth et al., 2005[14]; Hansom, 1981[15]). The long record from the Falklands has an upward sea level secular trend of 0.70 ± 0.18 mm year since 1964, about half the observed global figure.
References
- ↑ Church, J.A., Gregory, J.M., Huybrechts, P., Kuhn, M., Lambeck, K. Nhuan, M.T., Qin, D. and Woodworth, P.L. 2001. Changes in sea level. In Climate change 2001: the scientific basis. Contribution of Working Group I to the Third Assessment Report of the Intergovernmental Panel on Climate Change, J.T. Houghton, Y. Ding, D.J. Griggs, M. Noguer, P.J. van der Linden, X. Dai, K. Maskell and C.A. Johnson, eds. Cambridge University Press, Cambridge, 881pp.
- ↑ 2.0 2.1 2.2 2.3 2.4 IPCC 2007. Climate Change 2007: The Physical Science Basis. Contribution of the Intergovernmental Panel on Climate Change. Cambridge University Press, Cambridge.
- ↑ Meehl, G.A., T.F. Stocker, W.D. Collins, P. Friedlingstein, A.T. Gaye, J.M. Gregory, A. Kitoh, R. Knutti, J.M. Murphy, A. Noda, S.C.B. Raper, I.G. Watterson, A.J. Weaver, and Z.-C. Zhao, 2007: Global Climate Projections. In: Climate Change 2007: The Physical Science Basis. Contribution of Working Group I to the Fourth Assessment Report of the Intergovernmental Panel on Climate Change. Cambridge University Press, Cambridge, United Kingdom and New York, NY, USA, 749-845.
- ↑ Church, J.A. and White, N.J. 2006. A 20th century acceleration in global sea-level rise, Geophysical Research Letters, 33, L01602, 10.1029/2005GL024826.
- ↑ Jevrejeva, S., Grinsted, A., Moore J.C. and Holgate, S. 2006. Nonlinear trends and multi-year cycle in sea level records, Journal of Geophysical Research, 111, 2005JC003229.
- ↑ Holgate, S.J. and Woodworth, P.L. 2004. Evidence for enhanced coastal sea level rise during the 1990s, Geophysical Research Letters, 31, L07305, doi:10.1029/2004GL019626.
- ↑ 8.0 8.1 Rahmstorf, S., Cazenave, A., Church, J.A., Hansen, J.E., Keeling, R., Parker, D.E. and Somerville, R.C.J. 2007. Recent climate observations compared to projections, Science, 316, 709, doi:10.1126/science.1136843.
- ↑ Pfeffer, W.T, Harper, J.T. and O’Neill, S. 2008. Kinematic Constraints on Glacier Contributions to 21st-Century Sea-Level Rise, Science, 321, 1340-3.
- ↑ Gregory, J. and Huybrechts, P. 2006. Ice-sheet contributions to future sea-level change, Philosophical Transactions of the Royal Society A, 1709-1731.
- ↑ 11.0 11.1 Lowe, J.A., Gregory, J.M., Ridley, J., Huybrechts, P., Nicholls, R.J. and Collins, M. 2006. The role of sea-level rise and the Greenland ice sheet in dangerous climate change: Implications for the stabilisation of climate. In Avoiding Dangerous Climate Change, Schellnhuber, H.J., Cramer, W., Nakicenovic, N., Wigley, T. and Yohe, G. (eds). Cambridge University Press.
- ↑ 12.0 12.1 Church, J.A., White, N.J., Aarup, T., Wilson, W.S., Woodworth, P.L., Domingues, C.M., Hunter, J.R. and Lambeck, K. 2008. Understanding global sea levels: past, present and future, Sustainability Science, 3, 9-22, doi:10.1007/s11625-008-0042-4.
- ↑ Goring, D.G. and Pyne, A. 2003. Observations of sea-level variability in Ross Sea, Antarctica, New Zealand Journal of Marine and Freshwater Research, 37, 241-249.
- ↑ Woodworth, P.L., Pugh, D.T., Meredith, M.P. and Blackman, D.L. 2005. Sea level changes at Port Stanley, Falkland Islands, Journal of Geophysical Research, 110, C06013, doi:10.1029/2004JC002648.
- ↑ Hansom, J.D. 1981. Storm surging in South Geogia, British Antarctic Survey Bulletin, 53, 141-146.