Glacial interglacial cycles
- This page is part of the topic The last million years

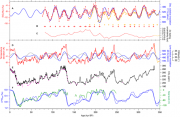
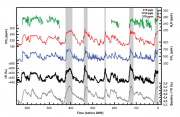
Ice cores spanning up to the past 800 ka provide some of the best records of Antarctic climate history and reveal not only the high degree of responsiveness of the ice sheet to changes in orbitally induced insolation patterns, but also a close association between atmospheric greenhouse gases and temperature (Figure 3.9 and Figure 3.10). Unlike today, the CO2 signal follows the temperature signal (Caillon et al., 2003[5]; Ahn et al., 2004[6]; Loulergue et al., 2007[7]; Lüthi et al., 2008[8]), signifying that changes in the concentrations of atmospheric CO2, as well as other greenhouse trace-gases, at the scale of the glacial-interglacial cycles were initiated by climatic mechanisms acting on their different reservoirs. Nevertheless, once CO2 began rising it would provide a positive feedback on temperature (Raynaud et al., 2003[9]; Jansen et al., 2007[10]). Köhler and Fischer (2006[11]) used various paleo-climatic records from the EPICA Dome C Antarctic ice core and from oceanic sediment cores covering the last 740 kyr to force a carbon cycle box model to provide constraints on the factors causing variation in the CO2 signal and its relation to temperature including: Southern Ocean vertical mixing, ocean temperature, iron limitation of the marine biota in the Southern Ocean, carbonate compensation, North Atlantic deep water formation, gas exchange due to a decreasing sea ice cover, sea level rise and rising terrestrial carbon storage. Other models have identified the importance of on and off states of the southern overturning circulation, a result of a positive feedback that involves the mid-latitude westerly winds, the mean temperature of the atmosphere, and the overturning of southern deep water. Cold glacial climates seem to have equatorward shifted westerlies, which allow more respired CO2 to accumulate in the deep ocean. Warm climates like the present have poleward shifted westerlies that flush respired CO2 out of the deep ocean (Toggweiler et al., 2006[12]).
The Antarctic ice core data show that the Earth’s climate has oscillated through eight glacial cycles over the last 800 ka, with CO2 and mean temperature values ranging from 180 ppm and 10ºC in glacials, to 300 ppm and 15ºC in interglacials (Jouzel et al., 2007[13]). The pattern has changed through time, with a fundamental reorganisation of the climate system at 900-600 ka from a world that for the preceding 33 million years had been dominated by 41 ka oscillations in polar ice volume, to a 100 ka climatic beat. It is critical to understand what caused the length of these cycles to change; a challenge that will likely be met by finding Antarctic locations where ice older than 1 Ma is present (IPICS, 2008[14]). As stated previously, the effect on global sea level was profound, with sea level dropping by 120 m on average during glacial periods (e.g. Figure 6.8 in Jansen et al. (2007[10])).
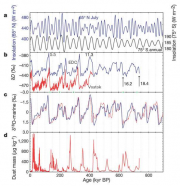
In order to separate the roles of orbital and greenhouse gas forcings on global climate, and to test Milankovitch theory of glacial cycles as the driver for the 100-kyr cycles, an accurate ice-core chronology to within ~2 kyr (~10 % of a precession cycle) is required. Such a chronology for 80-400 kyr BP have been realized by orbital tuning of the record of oxygen-to-nitrogen concentration ratio (O2/N2) in trapped air with the local summertime insolation (Kawamura et al., 2007[1]; Suwa and Bender, 2008[15]) (Figure 3.10, A-C). O2/N2 in the ice cores is depleted from the original atmospheric ratio because of physical fractionation during air trapping at ~100 m depth (Severinghaus and Battle, 2006[16]), and its magnitude is presumably controlled by physical properties of snow, which in turn is modified by local summer insolation when the layer was originally at the surface (Bender, 2002[17]). Although exact mechanisms are not yet well known, empirical evidence indicates that the O2/N2 variation is nearly phase-locked to the local summer solstice insolation, with negligible climatic influences (Kawamura et al., 2007[1]).
The Dome Fuji and Vostok temperature records on the new chronology closely follow boreal summer insolation (Figure 3.10, D). Thus, the previous arguments of early Antarctic warming following the southern summer insolation to trigger northern deglaciation are not supported. Further, the onsets of the last four Antarctic terminations are found to lag behind the minima of 65˚N June solstice insolation by 2-7 kyr. For the last three glacial inceptions, Antarctica cooled in phase with the decrease in northern summer insolation and before significant decreases seen in CO2 and sea level (Figure 3.10, D-F) curves. These timings are consistent with the Milankovitch theory that high northern latitude summer insolation drives the 100-kyr glacial cycles by changing summertime temperature and thus long-term glacial mass balance (Raymo, 1997[18]; Denton et al., 2006[19]), with large amplification by albedo and CO2 feedbacks. This view is supported by the analysis of marine sediment data (Bintanja and Van De Wal, 2008[20]) that shows the decrease in ice volume did not lag behind the increase of air temperature at the 100-kyr terminations after ~700 kyr BP.
An alternative view is that Antarctic temperature is independent of northern climate and is controlled by the duration of Antarctic summer, which shows nearly identical pattern to the northern summer insolation (intensity) (Huybers and Denton, 2008[21]). However, for the last termination, the onset of sea level rise (at 19 kyr BP) was earlier than that of the Antarctic warming (and CO2 rise), and there may be causal relationship between them through the bipolar seesaw mechanism (Clark et al., 2004[22]). In addition, tight bipolar coupling (see below) seems to operate for orbitally driven warming events (A4 and A7 events in Blunier and Brook (2001[23]); see also EPICA (2006[24])). Global climate modeling would be required to quantitatively estimate the contributions of local and distant orbital forcings to the Antarctic temperature (and CO2) changes.

Summer insolation intensity is dominated by the precession signal, whose amplitude is modulated by eccentricity. However, the obliquity signal becomes dominant if longer periods (e.g., half year average) or summer energy (time-integrated insolation over the days whose daily insolation exceed a certain threshold) (Huybers, 2006[26]) with a low threshold is taken into consideration. The last four terminations indeed started when obliquity was relatively large (Huybers and Wunsch, 2005[27]; Suwa and Bender, 2008[15]). With regard to the relative importance of precession and obliquity, termination III is interesting because the precession (as in northern summer insolation) and obliquity were out of phase just before the termination. Here, the pattern of temperature evolution is similar to northern summer insolation. A longer ice core record with the O2/N2 chronology is needed for investigating more terminations before this problem can be resolved. With the second Dome Fuji core (~720 kyr BP) (Motoyama, 2007[28]) and future deep cores (IPICS, 2008[14]), the accurate chronology will be extended to permit rigorous testing of the phase stability of terminations with respect to both precession and obliquity (Huybers and Wunsch, 2005[27]).


Ice cores from both Antarctica and Greenland show that temperatures were between 2-5ºC higher than today in recent past interglacials (Jansen et al., 2007[10]). This is matched by biological evidence in the lake sediment record in Antarctica (Hodgson et al., 2006a[37]). At the same time, global sea levels were 4-6 m higher than today’s (Jansen et al., 2007[10]). During the Pliocene, when temperatures were about the same amount above today’s values, sea levels were 15-25 m higher than today’s (Jansen et al., 2007[10]). The 10-20 m difference in sea levels between the Pliocene and the last interglacial, despite the fact that both shared more or less the same global temperature, may reflect the longer time available in the Pliocene to melt significant parts of the Antarctic ice sheet (the longest past interglacial lasted 30 ka – see Jansen et al. (2007[10])). Given that modern CO2 levels of around 380 ppm are higher than at any time in the last 850 ka (EPICA, 2004[25]) (Figure 3.13), and most likely in the last 25 million years (Royer, 2006[38]; Jansen et al., 2007[10]), the data from these past warm periods suggest that if the currently rising levels of CO2 drive temperatures to levels last seen in past interglacials or in the Pliocene, then high sea levels may be expected.
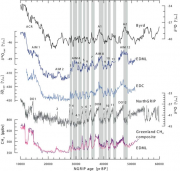
Understanding the dynamics of the Earth’s climate system requires knowledge of the phasing of climate events on regional to hemispheric scales. Methane emitted from wetlands is rapidly mixed throughout the atmosphere and can be used to correlate ice cores from Antarctica and Greenland. Using this technique it can be shown that climatic events of millennial to multi-centennial duration in the north and south polar regions are related (Figure 3.13, and EPICA (2006[24])), but exhibit a see-saw relationship. Antarctic warm events correlate with but precede those in Greenland, and vice versa (Figure 3.13). Warming in the Antarctic begins when Greenland is at its coldest during the so-called Dansgaard/Oeschger (D/O) events (Figure 3.13). One theory exploring this see-saw relationship states that D/O cold events, and their associated influx of meltwater, reduce the strength of the North Atlantic Deep Water current (NADW), weakening the Northern Hemisphere circulation and therefore resulting in an increased transfer of heat polewards in the Southern Hemisphere (Maslin et al., 2001[39]). This warmer water results in melting of Antarctic ice, thereby reducing density stratification and the strength of the Antarctic Bottom Water current (AABW). This allows the NADW to return to its previous strength, driving Northern Hemisphere melting and another D-O cold event. Eventually, the accumulation of melting reaches a threshold, whereby it raises sea level enough to undercut the Laurentide ice sheet - causing armadas of icebergs to discharge into the North Atlantic in a Heinrich event and resetting the cycle. The signals differ from one hemisphere to the other, warming being gradual in the Antarctic, but abrupt in Greenland (Figure 3.13). The relationship is thought to reflect the nature of the connection between the two hemispheres via the ocean’s meridional overturning circulation (MOC), with the lag reflecting the slow transfer of warmth from south to north. Heat retention in the Southern Ocean, and ocean circulation around Antarctica and globally may also reflect changes in the Antarctic ice sheet and sea ice extent (Stocker and Wright, 1991[40]; Knorr and Lohmann, 2003[41]). In any case it would appear that the paired and phase lagged events are linked responses to single climatic forcing events. The fact that today we see no phase lag in temperature between the two hemispheres is evidence for a new and different kind of forcing, as discussed in more detail later.
While the changes from glacial to interglacial states (Figure 3.13) are to some extent predictable, relying as they do on the Earth’s orbital behaviour, other kinds of change are not. These include the abrupt Dansgaard-Oeschger (D/O) cooling events in Greenland and their Antarctic counterparts, which occurred within the last glaciation (Figure 3.13). Equally, millennial to centennial scale variability observed within the past 12 ka in ice cores (see later) is not yet understood to the point of providing a firm basis for predictions of future change. The origins of these various cycles and events most likely relate to changes in global ocean circulation, atmospheric circulation, albedo dynamics, and solar variability. Their persistence through time, strong during glacials and weaker during interglacials (like the Holocene, see later), further suggests that such fluctuations can be expected in the future. Ice core data from the last glacial period in Greenland show that change at that time could proceed rapidly - with several increases of more than 10ºC within a decade to possibly one to two years (Figure 3.13); comparable changes in Antarctica were much slower.
References
- ↑ 1.0 1.1 1.2 Kawamura, K., Parrenin, F., Lisiecki, L., Uemura, R., Vimeux, F., Severinghaus, J.P., Hutterli, M.A., Nakazawa, T., Aoki, S., Jouzel, J., Raymo, M.E., Matsumoto, K., Nakata, H., Motoyama, H., Fujita, S., Goto-Azuma, K., Fujii, Y. and Watanabe, O. 2007. Northern Hemisphere forcing of climatic cycles in Antarctica over the past 360,000 years, Nature, 448, 912-916.
- ↑ Thompson, W.G. and Goldstein, S.L. 2005. Open-system coral ages reveal persistent suborbital sea-level cycles, Science, 308, 401-404.
- ↑ Bintanja, R., Van De Wal, R.S.W. and Oerlemans, J. 2005. Modelled atmospheric temperatures and global sea levels over the past million years, Nature, 437, 125-128.
- ↑ Waelbroeck, C., Labeyrie, L., Michel, E., Duplessy, J.C., McManus, J.F., Lambeck, K., Balbon, E. and Labracherie, M. 2002. Sea level and deep water temperature changes derived from bentic foraminifera isotopic records, Quat. Sci. Rev., 21, 295-305.
- ↑ Caillon, N., Severinghaus, J.P., Jouzel, J., Barnola, J.M., Kang, J.C. and Lipenkov, V. 2003. Timing of atmospheric CO2 and Antarctic temperature changes across termination III, Science, 299, 1728-1731.
- ↑ Ahn, J., Wahlen, M., Deck, B.L., Brook, E.J., Mayewski, P.A., Taylor, K.C. and White, J.W.C. 2004. A record of atmospheric CO2 during the last 40,000 years from the Siple Dome, Antarctica ice core. Journal of Geophysical Research-Atmospheres, 109, doi:10.1029/2003JD004415.
- ↑ Loulergue, L., Parrenin, F., Blunier, T., Barnola, J.M., Spahni, R., Schilt, A., Raisbeck, G. and Chappellaz, J. 2007. New constraints on the gas age-ice age difference along the EPICA ice cores, 0-50 kyr, Climate of the Past, 3, 527-540.
- ↑ Lüthi, D., Le Floch, M., Bereiter, B., Blunier, T., Barnola, J-M., Siegenthaler, U., Raynaud, D., Jouzel, J., Fischer, H., Kawamura, K. and Stocker, T.F. 2008. High-resolution carbon dioxide concentration record 650,000-800,000 years before present, Nature, 453, 379-382.
- ↑ Raynaud, D., Blunier, T., Ono, Y. and Delmas, R.J. 2003. The Late Quaternary History of Atmospheric Trace Gases and Aerosols: Interactions Between Climate and Biogeochemical Cycles. In: Alverson K, Bradley R, Pedersen T (eds), Paleoclimate, Global Change and the Future, Springer-Verlag, 13-35.
- ↑ 10.0 10.1 10.2 10.3 10.4 10.5 10.6 Jansen, E.J., Overpeck, K.R., Briffa, J-C., Duplessy, F., Joos, V., Masson-Delmotte, D., Olago, B., Otto-Bliesner, W.R., Peltier, S., Rahmstorf, R., Ramesh, D., Raynaud, D., Rind, O., Solomina, R., Villalba, R. and Zhang, D. 2007. Palaeoclimate. In: Solomon SD, Qin M, Manning Z, Chen M, Marquis KB, Averyt M, Tignor, Miller HL (eds) Climate Change 2007: The Physical Science Basis. Contribution of Working Group I to the Fourth Assessment Report of the Intergovernmental Panel on Climate Change. Cambridge University Press, Cambridge, United Kingdom and New York, NY, USA, 433-497.
- ↑ Köhler, P. and Fischer, H. 2006. Simulating low frequency changes in atmospheric CO2 during the last 740 000 years, Climate of the Past, 2,57-78.
- ↑ Toggweiler, J.R.,Russell, J.L. and Carson, S.R. 2006. Midlatitude westerlies, atmospheric CO2, and climate change during the ice ages, Palaeoceanography, 21, PA2005, doi:10.1029/2005PA001154.
- ↑ Jouzel, J., Masson-Delmotte, V., Cattani, O., Dreyfus, G., Falourd, S., Hoffmann, G., Minster, B., Nouet, J., Barnola, J.M., Chappellaz, J., Fischer, H., Gallet, J.C., Johnsen, S., Leuenberger, M., Loulergue, L., Luethi, D., Oerter, H., Parrenin, F., Raisbeck, G., Raynaud, D., Schilt, A., Schwander, J., Selmo, E., Souchez, R., Spahni, R., Stauffer, B., Steffensen, J.P., Stenni, B.S., Tison, J.L., Werner, M. and Wolff, E. 2007. Orbital and millenial Antarctic climate variability over the past 800,000 years, Science, 317, 793-796.
- ↑ 14.0 14.1 IPICS 2008. International Partnerships in Ice Core Sciences - white papers. In: Wolff E, Brook E (eds). http://www.pages.unibe.ch/ipics/steeringcommittee.html.
- ↑ 15.0 15.1 Suwa, M. and Bender, M.L. 2008. Chronology of the Vostok ice core constrained by O2/N2 ratios of occluded air, and its implication for the Vostok climate records, Quaternary Science Reviews, 27, 1093-1106.
- ↑ Severinghaus, J.P. and Battle, M. 2006. Fractionation of gases in polar ice during bubble close-off, new constraints from firn air Ne, Kr, and Xe observations, Earth and Planetary Science Letters, 244, 474-500.
- ↑ Bender, M.L. 2002. Orbital tuning chronology for the Vostok climate record supported by trapped gas composition, Earth and Planetary Science Letters, 204, 275-289.
- ↑ Raymo, M.E. 1997. The timing of major climate terminations, Paleoceanography, 12, 577-585.
- ↑ Denton, G.H., Broecker, W.S. and Alley, R.B. 2006. The mystery interval, 17.5 to 14.5 kyrs ago, PAGES news, 2, 14-16.
- ↑ Bintanja, R. and Van De Wal, R.S.W. 2008. North American ice-sheet dynamics and the onset of 100,000-year glacial cycles, Nature, 454, 869-872.
- ↑ Huybers, P. and Denton, G. 2008. Antarctic temperature at orbital timescales controlled by local summer duration, Nature Geoscience, 10, 1038/ngeo311.
- ↑ Clark, P.U., McCabe, A.M., Mix, A.C. and Weaver, A.J. 2004. Rapid rise of sea level 19,000 years ago and its global implications, Science, 304, 1141-1144.
- ↑ Blunier, T. and Brook, E.J. 2001. Timing of millennial-scale climate change in Antarctica and Greenland during the last glacial period, Science, 291, 109-112.
- ↑ 24.0 24.1 24.2 EPICA community members. 2006. One-to-one coupling of glacial climate variability in Greenland and Antarctica, Nature, 444, 195-198.
- ↑ 25.0 25.1 25.2 25.3 EPICA community members. 2004. Eight glacial cycles from an Antarctic ice core, Nature, 429, 623-628.
- ↑ Huybers, P. 2006. Early Pleistocene glacial cycles and the integrated summer insolation forcing, Science, 313, 508-511.
- ↑ 27.0 27.1 Huybers, P. and Wunsch, C. 2005. Obliquity pacing of the late Pleistocene glacial terminations, Nature, 434, 491-494.
- ↑ Motoyama, H. 2007. The second deep ice coring project at Dome Fuji, Antarctica, Scientific Drilling, 5, 41-43.
- ↑ Petit, J.R., Jouzel, J., Raynaud, D., Barkov, N.I., Barnola, J.M., Basile, I., Bender, M., Chappellaz, J., Davis, J., Delaygue, G., Delmotte, M., Kotyakov, V.M., Legrand, M., Lipenkov, V.Y., Lorius, C., Pépin, L., Ritz, C., Saltzman, E. and Stievenard, M. 1999. Climate and Atmospheric History of the Past 420000 years from the Vostok Ice Core, Antarctica, Nature, 399, 429-436.
- ↑ Indermühle, A., Monnin, E., Stauffer, B., Stocker, T.F. and Wahlen, M. 2000. Atmospheric CO2 concentration from 60 to 20 kyr BP from the Taylor dome ice core, Antarctica, Geophysical Research Letters, 27, 735-738.
- ↑ Siegenthaler, U., Monnin, K., Kawamura, R., Spahni, J., Schwander, B., Stauffer, T.F., Stocker, J-M., Barnola, H. and Fischer, H. 2005a. Supporting evidence from the EPICA Dronning Maud Land ice core for atmospheric CO2 changes during the past millennium, Tellus B, 57, 51-57.
- ↑ Siegenthaler, U., Stocker, T.F., Monnin, E., Luthi, D., Schwander, J., Stauffer, B., Raynaud, D., Barnola, J-M., Fischer, H., Masson-Delmotte, V. and Jouzel, J. 2005b. Stable Carbon Cycle-Climate Relationship During the Late Pleistocene, Science, 310, 1313-1317.
- ↑ Spahni, R., Chappellaz, J., Stocker, T.F., Loulergue, L., Hausammann, G., Kawamura, K., Fluckiger, J., Schwander, J., Raynaud, D., Masson-Delmotte, V. and Jouzel, J. 2005. Atmospheric Methane and Nitrous Oxide of the Late Pleistocene from Antarctic Ice Cores, Science, 310, 1317-1321.
- ↑ 34.0 34.1 Lisiecki, L.E. and Raymo, M.E. 2005. A Pliocene-Pleistocene stack of 57 globally distributed benthic d18O records, Paleoceanography, 20, PA1003, doi:1010.1029/2004PA001071.
- ↑ IPCC 2007. Climate Change 2007: The Physical Science Basis. Contribution of the Intergovernmental Panel on Climate Change. Cambridge University Press, Cambridge.
- ↑ Mayewski, P.A., Meredith, M.P., Summerhayes, C.P., Turner, J., Worby, A.P., Barrett, P.J., Casassa, G., Bertler, N.A.N., Bracegirdle, T.J., Naveira-Garabato, A.C., Bromwich, D.H., Campbell, H., Hamilton, G.H., Lyons, W.B., Maasch, K.A., Aoki, S., and Xiao, C. 2009. State of the Antarctic and Southern Ocean Climate System (SASOCS), Reviews of Geophysics, 47, RG1003, doi:10.1029/2007RG000231.
- ↑ Hodgson, D.A., Verleyen, E., Squier, A.H., Sabbe, K., Keely, B.J., Saunders, K.M. and Vyverman, W. 2006a. Interglacial environments of coastal east Antarctica: comparison of MIS 1 (Holocene) and MIS 5e (Last Interglacial) lake-sediment records, Quaternary Science Reviews, 25, 179-197.
- ↑ Royer, D.L. 2006. CO2-forced climate thresholds during the Phanerozoic, Geochim. Cosmochim. Acta, 70, 5665-5675.
- ↑ Maslin, M., Seidov, D. and Lowe, J. 2001. Synthesis of the nature and causes of rapid climate transitions during the Quaternary, Geophysical monograph, 126, 9-52.
- ↑ Stocker, T.F. and Wright, D.G. 1991. Rapid transitions of the ocean's deep circulation induced by changes in surface water fluxes, Nature, 351, 729-732.
- ↑ Knorr, G. and Lohmann, G. 2003. Southern Ocean origin for the resumption of Atlantic thermohaline circulation during deglaciation, Nature, 424, 532-536.
