In-situ ocean observations
- This page is part of the topic Observations, data accuracy and tools
The Southern Ocean plays a critical role in driving, modifying, and regulating global change. We need to be able to address the magnitude, variation, causes, and consequences of such change by monitoring the state of the ocean. However, conducting research in the Southern Ocean can be extremely challenging. Sea ice, high winds, rough seas, poor visibility, sub-zero temperatures, 24 hour winter darkness, and the icing of ships’ superstructures do not make for an easy environment in which to work. To obtain the required data requires a mixture of tried and tested techniques as well as the use of novel technology (e.g. Smith and Asper, 2007[1]).
Contents
Ship-based measurements
Taking measurements from a ship, whether by estimating currents from ship drift, taking samples of water to examine its properties or by catching and examining animals from the sea has been carried out to some extent since humans first took to the oceans. Even now taking measurements or samples from a ship is still the mainstay of in situ oceanographic observations.
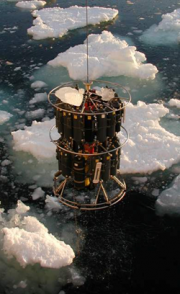
Many different sampling systems are used from ships, but by far the most common is the use of a package consisting of a water bottle array with a Conductivity-Temperature-Depth (CTD) probe that is lowered into the ocean when the ship stops on station (Figure 2.9). The CTD package most commonly includes sensors for conductivity (from which salinity can be derived) and temperature plus a pressure sensor. Other sensors, including those used to measure dissolved oxygen and photosynthetically active radiation as well as fluorometers, transmissometers and Acoustic Doppler Current Profilers (ADCPs) (to measure water velocity) are also routinely included. Water samples from the bottle array are taken to calibrate the conductivity sensors as well as to measure oxygen and its isotopes, nutrients, chlorofluorocarbons (CFCs), dissolved inorganic carbon and alkalinity, trace metals and a host of other parameters important to climate, biogeochemical and ecological studies.
When steaming between CTD stations, most research ships - and many so called ‘ships of opportunity’ - are equipped with a variety of underway samplers, for example sensors on the ships’ masts to record marine meteorological parameters such as wind speed and humidity, as well as other equipment taking measurements of the ocean such as thermosalinographs (that measure the temperature and salinity of the water a couple of metres below the surface) or hull-mounted ADCPs and echosounders.
Towed and tethered instruments
Instruments that can either be towed behind or tethered to ships (remotely operated vehicles) have provided substantial insights into biological and physical features and processes and are becoming increasingly sophisticated. SeaSoars (towed instruments that undulate in the upper 250 m or so of the ocean, and are equipped with temperature, salinity, fluorescence, and other sensors) have been used extensively in the Antarctic. For example, Hales and Takahashi (2007[2]) were able to determine the three-dimensional structure of hydrographic, chemical and biological variables in the southern Ross Sea. Remotely operated Vehicles (ROVs) can be equipped with sensors and samplers for water mass properties. Other towed systems such as the Continuous Plankton Recorder are also used routinely in the Southern Ocean (e.g. Hunt and Hosie, 2003[3]).
Autonomous vehicles
The types of autonomous vehicle vary widely, depending in part on the nature of propulsion and the sensor payload. AUVs (Autonomous Underwater Vehicles) use batteries or fuel cells as the primary power source for propulsion whereas gliders use variable buoyancy and have smaller power requirements, however paid by smaller speeds which is critical in strong currents.
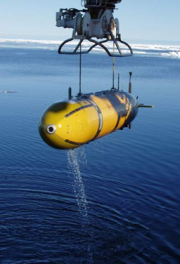
As an example, the AUV AutoSub-2 (Figure 2.10) has conducted high resolution surveys of krill abundance in the marginal ice zone of the Antarctic and found that krill were concentrated in a narrow band within roughly 1 km of the ice edge, in densities exceeding those in the open water and elsewhere in the marginal ice zone (Brierley et al., 2002[4]). Such small-scale distributions have profound implications for the foraging ecology and energy transfer within open-water food webs, and could not have been determined using ship-based surveys.
Both AUVs and gliders are capable of multidisciplinary sampling. As a result, there is increasing demand for better sensor development and more complex sensor configurations. A particular challenge is the use of such devices under ice where navagiation by returning to the surface is not possible. However, Autosub III recently spent significant time under the Pine Island Glacier, on traverses of up to 60 km and 30 hours under not just sea ice but several hundred metres of the floating glacier tongue.
Time series sites
Time series sites (e.g. http://www.oceansites.org/) consist of instrumentation measuring a range of parameters at a particular location repeatedly over time. They may consist of returning to a particular location to take repeat measurements or of instruments moored semi-permanently. Fixed instrumented moorings allow data collection of a suite of parameters, e.g. current or ice velocity, temperature and salinity for extended periods at a single location. Moorings are usually anchored to the seafloor with instruments extending upward by means of flotation, but may also be mounted within the ice, with a free hanging weight suspended below. As an example, the Weddell Sea Convection Control (WECCON) experiment has been investigating large-scale processes and long-term variations of convection in the Weddell Sea since 1996 (e.g. Fahrbach et al., 2004[5]). Moored instruments are particular useful in key locations to monitor outflow plumes of water masses from the Weddell Sea or determine transports through straits, such as the Drake Passage.
Tide gauges are essential for observing changes in sea level as well as for estimating volume transport variability, for example in the Antarctic Circumpolar Current (ACC) (e.g. Meredith et al., 2004[6]). The Antarctic tide gauge network includes gauges at coastal stations on the Antarctic continent, and also many gauges at Antarctic and Subantarctic Islands. However there are large gaps in some key areas, such as the Amundsen Sea.
A combination of bottom pressure recorders and Inverted Echosounders (PIES) which measure the traveltime of sound signals from the sea bed to the surface and back allow us to derive fluctuations of heat and mass transports through the change of bottom pressure and the sound velocity profile in the water column. The data can be related to the vertical distribution of temperature and salinity by use of the gravest empirical mode.
Floats and drifters
Data obtained from surface drifters and subsurface floats, particularly the Argo array (http://www.argo.ucsd.edu/), have made a huge impact on our understanding of the world’s oceans and hold tremendous promise for acquiring data to address critical questions for the Southern Ocean. Because of the problem of ice damage to floats and drifters, novel technologies and techniques have been developed to cope with these conditions, e.g. in the case of Argo, experimenting with subsurface tracking using Sound Fixing and Ranging (SOFAR) technology, storage of the profiles, and the adaptation of software to detect ice as the float attempts to surface to transmit its data to satellite (e.g. Klatt et al., 2007[7]). The installation of arrays of sound sources to be used by floats and gliders are a logistical and financial challenge. The application of ice-tethered platforms consisting of autonomous surface platforms on the ice with profiling instruments under the ice which are now common in the Arctic is restricted in the Antarctic due to the almost completely disappearing sea ice in summer.
Sensors on animals
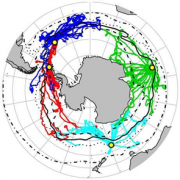
The use of innovative techniques, such as the deployment of small sensors on wide-ranging marine animals (Figure 2.11) has provided a wealth of data on their movements and behaviour as well as providing near real-time monitoring of ocean properties for long-term weather and climate analyses and forecasting (e.g. Biuw et al., 2007[8]).
Oceanographic data resources
In order to facilitate international exchange of scientific data a number of oceanographic data centres have been set up both as access points and repositories for such data. As well as National Data Centres there exist a number of international Data Assembly Centres that are dedicated to the collation, archival and delivery of data and products (see e.g. http://www.clivar.org/data/dacs.php). As an example, the CLIVAR (Climate Predictability and Variability Project) and Carbon Hydrographic Data Office is a repository and distribution centre for CTD and Hydrographic data sets (http://cchdo.ucsd.edu/). Other organizations both act to facilitate data exchange as well as providing access to the data itself, for example the World Data Center for Oceanography (http://www.nodc.noaa.gov/General/NODC-dataexch/NODC-wdca.html), the IOC’s International Oceanographic Data and Information Exchange (IODE) (http://www.iode.org/) and, covering the Southern Ocean region only, the Joint Committee for Antarctic Data Management (JCADM; http://www.jcadm.scar.org/).

A number of other resources exist for oceanographic data, for example the online Southern Ocean Atlas (http://woceatlas.tamu.edu/) includes a range of data products for the region south of 30°S (e.g. Figure 2.12). Static atlas products are available for browsing and downloading, but a suite of fully interactive tools are also provided where users can construct atlas illustrations using their own choice of parameters.
Southern Ocean READER is a portal for links to temperature, salinity and ocean current data from the Southern Ocean (http://www.antarctica.ac.uk/met/SCAR_ssg_ps/OceanREADER/).
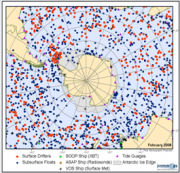
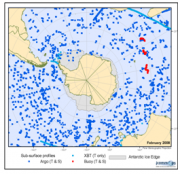
The Joint World Meteorological Organisation Intergovernmental Oceanographic Commission Technical Commission for Oceanography and Marine Meteorology in situ Observing Platform Support Centre (JCOMMOPS) provides coordination at the international level for oceanographic and marine observations from drifting buoys, moored buoys in the high seas, ships of opportunity and sub-surface profiling floats (http://www.jcommops.org; see Figure 2.13a and Figure 2.13b).
Observational problems
There is a suite of methods available to study the Southern Ocean. However, despite the importance of the region to global change, it is still one of the most data-sparse regions on the planet.
Currently we are not able to routinely monitor the characteristics of the ocean in the seasonally and permanently ice-covered region, which covers an area the size of Antarctica itself during the southern winter months. This is despite the efforts of extending Argo to the sea ice zone, the use of ice-tethered profilers and the inclusion of sensors on marine mammals that forage under the ice. Argo is currently also limited to the upper 2,000 m. In order to properly understand the processes that contribute to global change (e.g. understanding the overturning circulation) our monitoring efforts need to be extended to the deep ocean.
Measurements in the ice shelf environment, especially in the ice cavity regions beneath the ice shelves, are particularly difficult. Routine sustained monitoring is virtually unknown, but is required to understand how the ocean/ice shelf interaction will change as the climate alters, and what the impacts are for deep and bottom water formation and the global overturning in the ocean.
Because of the unique problems encountered at high latitudes, development of new sensors and methodologies is key, for example the addition of biogeochemistry sensors to Argo floats, or technology to study the long-term impact of seasonal ice cover on pelagic and benthic communities.
It is imperative to sample the polar oceans routinely and cost-effectively with an appropriate level of coverage to capture the main oceanographic and marine meteorological processes taking place that contribute to global change.
During the International Polar Year 2007-2008 - and beyond – one of the key aims is to monitor the Southern Ocean in a sustained manner (e.g. Summerhayes et al., 2007[9]). This is already underway with the development of a Southern Ocean Observing System (e.g. Sparrow, 2007[10]) that will incorporate the whole range of observations available to observe the marine physics and surface atmosphere, biogeochemistry and carbon, cryosphere and sea ice of the Southern Ocean.
References
- ↑ Smith, W. and Asper, V.A. 2007. New Ways to Collect Data in the Antarctic, EOS, Transactions American Geophysical Union, 88, no. 48, 525.
- ↑ Hales, B. and Takahashi, T. 2007. High-resolution biogeochemical investigation of the Ross Sea, Antarctica, during the AESOPS (U.S. JGOFS) Program, Global Biogeochemical Cycles, 18, GB3006, doi:10.1029/2003GB002165.
- ↑ Hunt, B.P.V. and Hosie, G.W. 2003. The Continuous Plankton Recorder in the Southern Ocean: a comparative analysis of zooplankton communities sampled by the CPR and vertical net hauls along 140 E, Journal of Plankton Research, 25, 1561-1579.
- ↑ Brierley, A.S., Fernandes, P.G., Brandon, M.A., Armstrong, F., Millard, McPhail, S.D., Stevenson, P., Pebody, M., Perrett, J., Squires, M., Bone, D.G. and Griffiths, G. 2002. Antarctic Krill under sea ice: elevated abundance in a narrow band just south of ice edge, Science, 295, 1890-1892.
- ↑ Fahrbach, E., Hoppema, M., Rohardt, G., Schröder, M. and Wisotzki, A. 2004. Decadal-scale variations of water mass properties in the deep Weddell Sea, Ocean Dynamics, 54, 77-91.
- ↑ Meredith, M.P., Woodworth, P.L., Hughes, C.W. and Stepanov, V. 2004. Changes in the ocean transport through Drake Passage during the 1980s and 1990s, forced by changes in the Southern Annular Mode, Geophysical Research Letters, 31(21), L21305, 10.1029/2004GL021169.
- ↑ Klatt, O., Boebel, O. and Fahrbach, E. 2007. A profiling float’s sense of ice, J. Atmos. Oceanic Technol., 24, 1301-1308.
- ↑ 8.0 8.1 Biuw, M., Boehme, L., Guinet, C., Hindell, M., Costa, D., Charrassin, J.-B., Roquet, F. Bailleul, F., Meredith, M., Thorpe, S.R., Tremblay, S., McDonald, Y., Park, B., Rintoul, Y.-H., Bindoff, N., Goebel, M., Crocker, D., Lovell, P., Nicholson, J., Monks, F. and Fedak, M.A. 2007. Variations in behaviour and condition of a Southern Ocean top predator in relation to in situ oceanographic conditions, Proceedings of the National Academy of Sciences, 104, 34, 13705-13710.
- ↑ Summerhayes, C., Dickson, B., Meredith, M., Dexter P. and Alverson, K. 2007. Observing the Polar Oceans during the International Polar Year and Beyond, WMO Bulletin, 56 (4), 270-2893.
- ↑ Sparrow, M. 2007. The Southern Ocean Observing System, CLIVAR Exchanges, 12, No.4 Oct. 2007.
