The role of the Antarctic in the global climate system
- This page is part of the topic The Antarctic environment in the global system
The global climate system is driven by solar radiation, most of which, at any one time, arrives at low latitudes. Over the year as a whole the Equator receives about five times as much radiation as the poles, creating a large Equator-to-pole temperature difference. The atmospheric and oceanic circulations respond to this large horizontal temperature gradient by transporting heat polewards (Trenberth and Caron, 2001[1]). In fact the climate system can be regarded as an engine, with the low latitude areas being the heat source and the polar regions the heat sink. Although the dynamics of atmosphere-ocean interaction are well known, the complexities of the heat exchange engine and the interactions of ice shelves and land ice with the ocean and atmosphere make predictions about climate change a challenge.
The combination of tropical heating, poleward moving air and the Coriolis Force imposed by the Earth’s rotation, leads to the development of the Hadley Cell, an atmospheric circulation in which air rises at the equator, creating the tropical belt of low pressure, and descends in the subtropics, forming the subtropical high pressure belt. At higher latitudes (60-65ºS) the air ascends again, creating a low-pressure zone. The pressure gradient at the Earth’s surface between the high pressure in the subtropics and the low pressure at 60-65ºS forces air to move eastwards under the influence of the Earth’s rotation, creating the mid-latitude westerlies that help to drive surface waters east in the ACC. The air ascending at 60-65ºS moves poleward at upper levels and sinks again over the poles, forming a high-pressure system over the Antarctic continent. The pressure gradient from the low pressure at 60-65ºS to the high pressure over the continent gives rise to easterly winds along the Antarctic coast, driving the westward-directed Antarctic Coastal Current over the continental shelf; that shelf current tends to be focused along the fronts of ice shelves (Deacon, 1937[2]), Heywood et al, 2004[3], Ismael Núñez-Riboni and Fahrbach, 2009[4]). The main westward flow is that associated with the Antarctic Slope Front, over the continental slope. The north-to-south distribution of surface pressure around Antarctica is subject to remarkable variability in the intensity of the meridional pressure gradient and its zonal location. Due to the circumpolar character of this variation it is called the Southern Annular Mode (of variability) (SAM) (See Trenberth et al., 2007[5] for a review). The SAM can also be seen as a measure of the intensity of the westerly winds that propel the ACC. The SAM is the southern hemisphere equivalent of the Arctic Oscillation (also known as the Northern Annular Mode) or the related North Atlantic Oscillation, which is measured from the pressure difference between the Azores and Iceland. Variations in the SAM (which can be thought of as variations in a North - South pressure gradient) drive variability in the Southern Ocean’s winds and currents: the steeper the gradient, the stronger the winds. In addition to the SAM, there are other significant modes of variability with meridional or zonal patterns.

Both the atmosphere and ocean play major roles in the poleward transfer of heat (Trenberth and Caron, 2001[1]), with the atmosphere being responsible for 60% of the heat transport, and the ocean the remaining 40%. In the atmosphere, heat is transported by both low-pressure systems (depressions) and the mean flow. Clockwise-circulating depressions carry warm air poleward on their eastern sides and cold air towards lower latitudes on their western flanks. The atmosphere is able to respond relatively quickly to changes in the high or low latitude heating rates, with storm tracks and the mean flow changing on scales from days to years. The process by which air arrives at the poles also imports pollutants from industrialised areas, though quantities are tiny compared with the Arctic, not least because most industrialised areas are in the north, and the mean flow is zonal around Antarctica rather than more meridional - as in the Arctic.

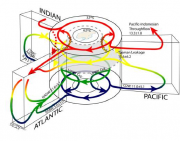
The oceans carry heat and salt south towards the pole in upper ocean surface currents moving down the western sides of the Atlantic, Pacific and Indian Ocean basins (e.g. Schmitz, 1995[7], Lumpkin and Speer, 2007[6], Figure 1.8). In addition, heat and salt move south through the Atlantic Ocean in the sub-surface in North Atlantic Deep Water, which rises to the surface near the Antarctic coast (Figure 1.8 and Figure 1.9), as a consequence of upwelling driven by the divergence of surface water forced north by the westerly winds of the Southern Ocean (e.g. Rintoul et al, 2001[8]). In addition to their transport by the large-scale currents, heat and salt are transported by mesoscale eddies (with diameters of tens to hundreds of kilometers). In the Southern Ocean, where the meridional currents are normally small, meridional transport by eddies is significant (e.g. de Szoeke and Levine, 1981[9]; Bryden, 1979[10]; Hughes and Ash, 2001[11]; Rintoul et al, 2001[8]; Hogg et al., 2008[12]).
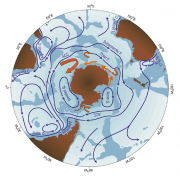
Eastward circulation is focused in the ACC, which lies broadly between the Southern Boundary Front (SB) and the Sub-Antarctic Front (SAF) (Rintoul et al, 2001[8], compare Figures 1.2 and 1.9). The core of the ACC lies roughly beneath the core of the predominant westerly winds. The ACC is an outstanding feature in the global ocean’s circulation. Stretching over a length of around 20,000 km, it is the only current to completely encircle the globe. It transports around 140 × 106 m3 of water per second (140 Sverdrups), making it the world’s largest ocean current. And it links the three main ocean basins (Atlantic, Pacific and Indian) into one global system by transporting heat and salt from one ocean to another.
The westerly winds of the Southern Ocean act on the surface waters, which are forced north under the influence of the Coriolis Force of the Earth’s rotation. Deep water from below wells up to replace these surface waters, as is evident from Figure 1.9. This ascent (e.g. Schmitz, 1995[7]; Lumpkin and Speer, 2007[6]) from the deep in the ACC forms the upward part of the global overturning circulation. The northward moving surface water is cold and dense and sinks at the Polar Front to form Antarctic Intermediate Water (Wüst, 1935[13]), which sinks northward at intermediate depths to permeate the world’s oceans especially in the Southern Hemisphere (McCartney, 1982[14]). Some of the surface water reaches the SAF, where it sinks to form Sub-Antarctic Mode Water (Hanawa and Talley, 2001[15]). Due to the excess of precipitation over evaporation at these latitudes, the surface water gets lighter as is moves north (gain of buoyancy in Figure 1.9), which explains how the Mode Water (lighter) comes to overlie the Intermediate Water (heavier), despite their having the same source. South of the divergence zone, where upwelling takes place, the surface waters reaching coastal seas are cooled by contact with ice, and pick up salt rejected when surface waters freeze to form sea ice, so losing buoyancy (Figure 1.9) and becoming dense enough to sink. The sinking waters cascade down the continental shelf (Baines and Condie, 1998[16]; Foldvik et al. 2004[17]) and slope to form Antarctic Bottom Water, which spreads around Antarctica (Orsi et al, 1999[18]) and aerates most of the global deep ocean floor (e.g. Wüst, 1935[13]; Hogg, 2001[19]). These sinking cold waters provide a fairly uniform cold environment for bottom dwelling (benthic) organisms.

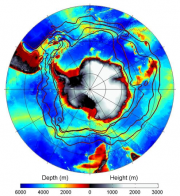
Jets along the SAF and the PF typically carry a large fraction of the transport of the ACC (Figure 1.9 and Figure 1.10; and Cunningham et al., 2003[24]), but other fronts can have comparable transports across individual hydrographic sections. In fact, the ACC is not a single front but a complex system of fronts (e.g. Sokolov and Rintoul, 2002[25]), several of which are thought to be of circumpolar extent (Orsi et al., 1995[26]). This complex system approach provides a new paradigm for considering the response of the ACC to climate change.
Superimposed on the circumpolar circulation system are regional clockwise gyres, principally the Weddell Gyre and Ross Gyre (Figure 1.10), whose southern boundaries are the west-moving Slope Current, and whose outer limits reach to the east-moving ACC. These gyres constitute the detailed pathway for transport to, from, and along the continental margin. They are visible in traditional hydrographic surveys as dome-shaped structures surrounded by downward sloping masses of equal density that extend towards the coast in the south and towards the ACC in the north. They are also clearly revealed in Southern Ocean numerical model outputs. Estimates of the extent of transport in the gyres are few. The Weddell Gyre carries 30 +/- 10 Sverdrups (Sv) in the Weddell Sea (Fahrbach et al., 1994[27]) and 56 +/- 8 Sv across the Greenwich Meridian (Klatt et al, 2005[28]). The Ross Gyre transports 40 Sv across longitude 150ºW, and the Australian-Antarctic Gyre 76 +/- 26 Sv across longitude 110ºE (McCartney and Donohue, 2007[23]).

The distribution of land and sea in the two polar regions is responsible for the very different atmospheric and oceanic circulations observed in each. Antarctica is a continent surrounded by ocean, while the Arctic is an ocean surrounded by land. The Antarctic continent is a sub-circular dome lying over the pole and surrounded by a broad swath of deep ocean, apart from the slight constriction of Drake Passage between the Antarctic Peninsula and South America (Fig. 1.10). As a result, the mean atmospheric flow and surface ocean currents are zonal in nature (parallel to latitude). The ACC, which is the major oceanographic feature of the Southern Ocean, flows unrestricted around the continent (Figure 1.2 and Figure 1.8), isolating the cold high latitude land and sea areas from warm temperate mid- and low-latitude surface waters. This has only been the case since about 30 million years ago when the Drake Passage opened up, as discussed in greater detail in The Greenhouse world. Before then the ocean currents had more of a meridional component (parallel to longitude), which allowed greater poleward penetration of warm waters from temperate latitudes. In contrast, as mentioned earlier, surface ocean circulation in the Arctic tends to be meridional, especially the northward flow of warm water at the surface in the North Atlantic Current.

The Southern Ocean plays a key role in the global carbon cycle. The upwelling deep water south of the Polar Front (Figure 1.8 and Figure 1.9) brings to the surface dissolved nutrients and carbon dioxide (CO2), and releases this gas to the atmosphere. In contrast, the Intermediate Water and Mode Water masses sinking north of the Polar Front (Figure 1.9) take up CO2 from the atmosphere. These complementary processes make the Southern Ocean both a source and a sink for atmospheric CO2 (see Figure 1.11; from Sabine et al., 2004[29]).
Because of its upwelling nutrients, the Southern Ocean is the world’s most biologically productive ocean. Nonetheless, its productivity is limited by the low availability of micronutrients such as iron, except around the islands that are scattered through the ACC. As a result the Southern Ocean is classified as High Nutrient Low Chlorophyll (HNLC). Through photosynthesis, the growth of phytoplankton extracts CO2 from the atmosphere and pumps it to the seabed or into subsurface waters through the sinking of decaying organic matter. Without this process, and without the solution of carbon dioxide in cold dense sinking water near the coast, the build up of carbon dioxide in the atmosphere would be much faster.
CO2 is exchanged between the ocean and the atmosphere primarily through air-sea fluxes, which are highly variable in space and time (Mahadevan et al., 2004[30]; Volk and Hoffert, 1985[31]) balancing to within 2% (net) when integrated globally (Watson and Orr, 2003[32]).

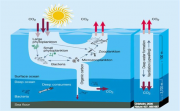
Surface ocean CO2 levels (pCO2) and their related atmospheric CO2 levels can be described as being controlled by the combination of physical and biological processes that move CO2 from the upper ocean into the deep ocean. These processes can be separated into the “physical pump” and the “biological pump” (Figure 1.12). The biological pump is the most effective at removing carbon from the system through burial in sediments. Both pumps are effective at transferring CO2 to deep water.
The biological pump refers to the biological cycling of ocean carbon into the ocean interior. It is a complex process operating over timescales from hours to months, and is dependent on the physical processes of ocean mixing and transport (Anderson and Totterdell, 2004[34]). The first stage is fixing dissolved inorganic carbon (DIC) into dissolved organic carbon (DOC) by photosynthesis in the euphotic zone; the amount of carbon fixed is crudely proportional to the nutrients available. Most of this DOC is then processed, consumed and recycled by the marine ecosystem within the euphotic zone. Some of the organic material in the euphotic zone is exported, sinking under gravity to be either remineralised by the benthos (converted back into DIC) or buried in the seafloor as sediment. As a rule the biological pump always acts to reduce surface seawater pCO2 levels.
The physical pump describes the role of ocean dynamic and thermodynamic processes in changing the distribution of dissolved carbon between the upper ocean and the deep ocean. Dynamical processes that can impact the distribution of CO2 in the upper ocean include changes in the rate or volume of upwelling or downwelling waters, and buoyancy or wind driven mixing. The thermodynamic response of the carbonate system is such that at a fixed atmospheric pCO2, the upper ocean (in contact with the air) can hold more dissolved inorganic carbon at cooler ocean temperatures than at warmer temperatures.
The carbon in the ocean is a mixture from both natural and anthropogenic sources. The anthropogenic fraction comes from human-induced emissions of CO2 into the atmosphere that have continued at an increasing rate since the start of the industrial revolution and in 2007 were approaching 10 PgC/yr (where 1 petagram (Pg) = 1015 grams CO2 equivalent, which is equal to 109 metric tons C) (Canadell et al., 2007[35]). It is estimated that 30% of total anthropogenic emissions annually are taken up from the atmosphere and sequestered by the ocean (Sabine et al., 2004[29]). Regardless of source (natural or anthropogenic) the carbon in the ocean follows the carbon cycle described above.
References
- ↑ 1.0 1.1 Trenberth, K.E. and Caron, J.M. 2001. Estimates of meridional atmosphere and ocean heat transports, Journal of Climate, 13, 4358-4365.
- ↑ Deacon, G.E.R. 1937. The hydrology of the Southern Ocean, Discovery Reports, 15, 1-124.
- ↑ Heywood, K. J., Naveira-Garabato, A.C., Stevens, D.P., and Muench, R.D. 2004. On the fate of the Antarctic Slope Front and the origin of the Weddell Front, Journal of Geophysical Research, 109 (C06021), 1-13.
- ↑ Núñez-Riboni, I. and Fahrbach, E. 2009. Seasonal variability of the Antarctic Coastal Current and its driving mechanisms in the Weddell Sea, Deep-Sea Research I, in press.
- ↑ Trenberth, K.E. Et AL. 2007. Observations: Surface and Atmospheric Change. Contribution of Working Group I to the Fourth Assessment Report of the Intergovernmental Panel on Climate Change,. In: D.Q. S. Solomon, M. Manning, Z. Chen, M. Marquis, K.B. Averyt, M. Tignor and H.L. Miller (Editor), Climate Change 2007: The Physical Science Basis. Cambridge University Press,, Cambridge, U.K., and New York, U.S.A.
- ↑ 6.0 6.1 6.2 Lumpkin, R. and Speer, K. 2007. Global ocean meridional overturning, Journal of Physical Oceanography, 37, 2550-2562.
- ↑ 7.0 7.1 Schmitz, W. J. 1995. On the Interbasin-scale Thermohaline Circulation, Reviews of Geophysics, 33, 2, American Geophysical Union, 151-173.
- ↑ 8.0 8.1 8.2 8.3 8.4 Rintoul, S.R., Hughes, C.W. and Olbers, D. 2001. The Antarctic Circumpolar Current system. In: Eds. G. Siedler, J. Church and J. Gould, Ocean circulation and climate; observing and modelling the global ocean. International Geophysics Series, 77, 271-302, Academic Press.
- ↑ De Szoeke, R.A. and Levine, M.D. 1981. The advective flux of heat by mean geostrophic motions in the Southern Ocean, Deep-Sea Research, 28, 1057-1085.
- ↑ Bryden, H.L. 1979. Poleward heat flux and conversion of available potential energy in Drake Passage, Journal of Marine Research, 37, 1-22.
- ↑ Hughes, C.W. and Ash, E.R. 2001. Eddy forcing of the mean flow in the Southern Ocean, Journal of Geophysical Research, 106, 2713-2722.
- ↑ Hogg, A.M., Meredith, M.P., Blundell, J.R. and Wilson, C. 2008. Eddy heat flux in the Southern Ocean: Response to variable wind forcing, Journal of Climate, 21(4), 608-620.
- ↑ 13.0 13.1 Wüst, G. 1935. The Stratosphere of the Atlantic Ocean. Scientific Results of the German Atlantic Expedition of the Research Vessel “Meteor” 1925-1927 (English translation, E.J. Emery (ed.), Amerind, new Delhi, 1978), 6, 109-288.
- ↑ McCartney, M.S. 1982. The subtropical circulation of Mode Waters, Journal of Marine Research, 40 (suppl), 427-464.
- ↑ Hanawa, K. and Talley, L.D. 2001. Mode Waters. In: Eds. G. Siedler, J. Church and J. Gould, Ocean circulation and climate; observing and modelling the global ocean, International Geophysics Series, 77, 373-386, Academic Press.
- ↑ Baines, P.G. and Condie, S. 1998. Observations and modelling of Antarctic downslope flows: a review. In Ocean, Ice and Atmosphere: Interactions at the Antarctic Continental Margin, AGU Antarctic Research Series Vol. 75, S.S. Jacobs and R. Weiss editors, 29-49.
- ↑ Foldvik, A., Gammelsrod, T., Osterhus, S., Fahrbach, E., Rohardt, G., Schroder, M., Nicholls, K.W., Padman, L. and Woodgate, R.A. 2004. Ice shelf water overflow and bottom water formation in the southern Weddell Sea, J. Geophys. Res., 109, C02015, doi:10.1029/2003JC002008.
- ↑ Orsi, A.H., Johnson, G.C. and Bullister, J.B. 1999. Circulation, mixing and production of Antarctic Bottom Water, Prog. Oceanog., 43, 55-109.
- ↑ Hogg, N.G, 2001. Quantification of the deep Circulation. In: Eds. G. Siedler, J. Church and J. Gould, Ocean circulation and climate; observing and modelling the global ocean, International Geophysics Series, 77, 259-270, Academic Press.
- ↑ Wang, Z. and Meredith, M.P. 2008. Density-driven Southern Hemisphere subpolar gyres in coupled climate models, Geophysical Research Letters, 35(14) 5, pp. 10.1029/2008GL034344.
- ↑ Smith, N.R., Dong, Z. Kerry, K.R. and Wright, S. 1984. Water masses and circulation in the region of PrydzBay, Antarctica, Deep-sea Research, 31, 1121-1147.
- ↑ Heywood, K.J., Sparrow, M.D., Brown, J. and Dickson, R.R. 1999. Frontal structure and Antarctic Bottom Water flow through the Princess Elizabeth Trough, Antarctica, Deep-Sea Research I, 46, 1181-1200.
- ↑ 23.0 23.1 McCartney, M.S. and Donohue, K.A. 2007. A deep cyclonic gyre in the Australian-Antarctic Basin, Progress in Oceanography, 75, 675-750.
- ↑ Cunningham, S.A., Alderson, S.G., King, B.A. and Brandon, M.A. 2003. Transport and variability of the Antarctic Circumpolar Current in Drake Passage. J. Geophys. Res., 108 (C5), 8084, doi:10.1029/2001JC001147.
- ↑ Sokolov, S. and Rintoul, S.R. 2002. The structure of Southern Ocean fronts at 140E, Journal of Marine Systems, 37, 151-184.
- ↑ 26.0 26.1 Orsi, A.H., Whitworth III, T.W. and Nowlin Jr.,W.D. 1995. On the meridional extent and fronts of the Antarctic Circumpolar Current, Deep-Sea Res., 42, 641-673.
- ↑ Fahrbach, E., Rohardt, G., Schroder, M. and Strass, V. 1994. Transport and structure of the Weddell Gyre, Ann. Geophysicae, 12, 840-855.
- ↑ Klatt, O., Fahrbach, E., Hoppema, M. and Rohardt, G. 2005. The transport of the Weddell Gyre across the Prime Meridian, Deep-Sea Research II, 52, 513-528.
- ↑ 29.0 29.1 29.2 Sabine, C.L., ET AL. 2004. The Oceanic Sink for Anthropogenic CO2, Science, 305, 367-371.
- ↑ Mahadevan, A., Levy, M. and Memery, L. 2004. Mesoscale variability of sea surface pCO2: What does it respond to?, Global Biogeochemical Cycles, 18 (1), GB1017/10.1029/2003GB002102.
- ↑ Volk, T. and Hoffert, M.I. 1985. Ocean Carbon Pumps: Analysis of relative strenghts and efficencies in ocean-driven atmospheric CO2 changes, Geophys. Monogr., 32, 99-110.
- ↑ Watson, A.J. and Orr, J.C. 2003. Carbon Dioxide Fluxes in the Global Ocean, in Ocean Biogeochemistry: The Role of the Ocean carbon Cycle in Global Change, edited by M. J. R. Fasham, Springer, Heidelberg.
- ↑ Chisholm, S.W. 2000. Stirring times in the Southern Ocean, Nature, 407, 685-687.
- ↑ Anderson, T.R. and Totterdell, I.J. 2004. Modelling the response to the biological pump to climate change., in The Ocean Carbon Cycle and Climate, edited by M. Folllows and T. Oguz, Kluwer Academic Press, Netherlands, 65-96.
- ↑ Canadell, J.G., and 9 other authors. 2007. Contributions to accelerating atmospheric CO2 growth from economic activity, carbon intensity, and efficiency of natural sinks, PNAS, doi:10.1073/pnas.0700609104.