Search results
Create the page "The Antarctic ice sheet" on this wiki! See also the search results found.
Page title matches
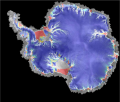
File:Figure 2.24 - Composite of the Antarctic ice sheet surface speed.png ...Antarctic Mapping Project. BPRC Report No. 22, Byrd Polar Research Center, The Ohio State University, Columbus, Ohio, 64 p.</ref>.(539 × 458 (279 KB)) - 15:31, 6 August 2014

Page text matches
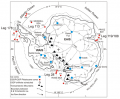
File:Figure 3.1 - Map of Antarctica showing locations of selected deep ice and sediment cores.png ...at Seymour Island (SI), James Ross Island (JRI), Alexander Island (AI) and the Beardmore Glacier region (BG).(512 × 422 (151 KB)) - 15:30, 6 August 2014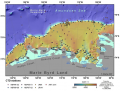
File:Figure 4.25 - Amundsen Sea bathymetric chart and hydrographic stations of different cruises.png ...ers refer to the Nathaniel B. Palmer (NBP), the James Clark Ross (JCR) and the Polarstern (ANT).(637 × 481 (343 KB)) - 15:30, 6 August 2014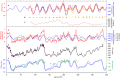
File:Figure 3.10 - Accurately dated Antarctic ice-core records and the comparison with sea level proxies.png ...ans, J. 2005. Modelled atmospheric temperatures and global sea levels over the past million years, ''Nature'', '''437''', 125-128.</ref>) and regression a(611 × 396 (118 KB)) - 15:30, 6 August 2014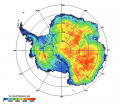
File:Figure 1.5 - Antarctic ice thickness.png ...nent ice shelves that represent floating extensions of the continental ice sheet. From Lythe, Vaughan and BEDMAP Consortium, 2001.(624 × 542 (347 KB)) - 15:31, 6 August 2014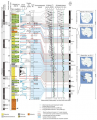
File:Figure 3.8 - Lithological column for the upper 600m of the AND-1B drillcore.png ...lch, T. and Williams, T. 2009. Obliquity-paced Pliocene West Antarctic ice sheet oscillations, ''Nature'', '''458''', 322-328.</ref>).(562 × 694 (486 KB)) - 15:31, 6 August 2014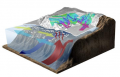
File:Figure 4.41 - Pictorial view of the ocean-ice system of the Ross Sea.png ...ere (wavy vertical line) while the remainder circulated under the floating ice shelf causing basal melting. (illustration courtesy of National Geographic)(533 × 342 (194 KB)) - 15:31, 6 August 2014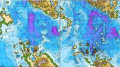
File:Figure 2.33 - Bed elevations of the Amundsen Sea Embayment.png ...n shows that the recent surveys provided a more detailed representation of the subglacial topography.(447 × 250 (342 KB)) - 15:31, 6 August 2014
File:Figure 3.19a - Antarctic and Greenland holocene climate change compared using ice core data.png ...Annals of Glaciology'', '''39''', 127-132.</ref>, 2005). Green bar denotes the 8,800-8,200 year ago event seen in many globally distributed records associ(414 × 807 (400 KB)) - 15:31, 6 August 2014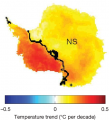
File:Figure 4.8c - Winter season temperature trends reconstructed using infrared satellite data.png ...and Shindell, D.T. 2009. Warming of the Antarctic ice-sheet surface since the 1957 International Geophysical Year, ''Nature'', '''457''', 459-462.</ref>)(455 × 500 (175 KB)) - 15:31, 6 August 2014
File:Figure 3.7 - View of the Victoria Land coast off Cape Roberts during Oligocene and early Miocene times.png ...e filled circle. TAM = Transantarctic Mountains, EAIS = East Antarctic Ice Sheet.(479 × 471 (169 KB)) - 15:31, 6 August 2014- ...page is part of the topic [[Antarctic climate and environment change over the next 100 years]]'' ...and and Antarctica). The amount of thermal expansion is non-uniform due to the influence of ocean currents and spatial variations in ocean warming. Global16 KB (2,491 words) - 13:16, 22 August 2014
- ...itions across the Southern Ocean, ocean conditions, the sea ice extent and the terrestrial and marine biology. ...emainder of the Nineteenth Century and it was not possible to venture into the inhospitable interior of Antarctica.3 KB (501 words) - 16:48, 6 August 2014
- ...f the changes observed in recent decades. This is particularly the case in the ocean where we have few long time series of physical measurements and remar ...as near-surface air temperature it is possible to use the projections from the various models to derive various estimates of how temperature may change ov5 KB (788 words) - 16:49, 6 August 2014
- ...and its effects on global sea level, and the changing distribution of sea ice and its effect on climate are then described. ...tanding of the climate and biological changes that might be anticipated in the near future (Chapter 5).17 KB (2,554 words) - 16:45, 6 August 2014
- ...rld where greenhouse gas concentrations are much higher than occurred over the last few centuries. ...SCAR Advisory Group on ACCE] has overall responsibility for the content of the wiki and plan to keep it up to date as new research results emerge. We hope4 KB (504 words) - 17:51, 21 August 2014
- :''This page is part of the topic [[The last million years]]'' ...e-dynamic reconstructions of the Greenland and Antarctic ice sheets during the glacial cycles, ''Quaternary Science Reviews'', '''21''', 203-231.</ref>).21 KB (3,294 words) - 15:33, 6 August 2014
- ...is page is part of the topic [[Antarctic climate and environment change in the instrumental period]]'' ...were reliant on sparse ship observations that were mainly collected during the summer months.22 KB (3,536 words) - 13:25, 22 August 2014
- :''This page is part of the topic [[Atmospheric change over the next 100 years]]'' ==Antarctic stratospheric ozone over the next 100 years==27 KB (4,305 words) - 16:22, 6 August 2014
- ...is page is part of the topic [[Antarctic climate and environment change in the instrumental period]]'' ==Antarctic stratospheric ozone in the instrumental period==43 KB (6,788 words) - 17:07, 22 August 2014
- ...is page is part of the topic [[Antarctic climate and environment change in the instrumental period]]'' ...random sample, and can ‘describe’ a significant proportion of the total circulation variability.54 KB (8,177 words) - 13:38, 22 August 2014


