File list
Jump to:
navigation
,
search
This special page shows all uploaded files.
File list
Items per page:
20
50
100
250
500
Search for media name:
Username:
Include old versions of images
Date
Name
Thumbnail
Size
User
Description
Versions
14:31, 6 August 2014
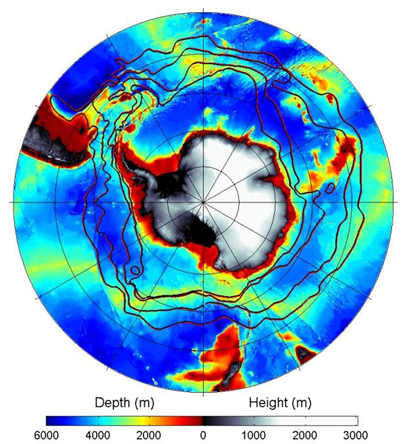
Figure 1.2 - Antarctic topography and bathymetry.png
(
file
)
307 KB
Maintenance script
Uploaded by import script
1
14:31, 6 August 2014
Figure 1.3 - Antarctic surface elevation.png
(
file
)
416 KB
Maintenance script
Uploaded by import script
1
14:31, 6 August 2014
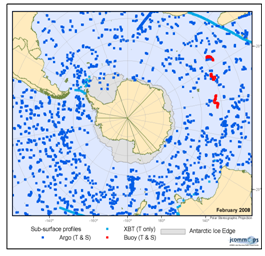
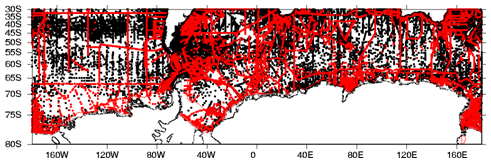
Figure 2.13b - JCOMMOPS Southern Ocean region sub-surface profiles as of February 2008.png
(
file
)
95 KB
Maintenance script
Uploaded by import script
1
14:31, 6 August 2014
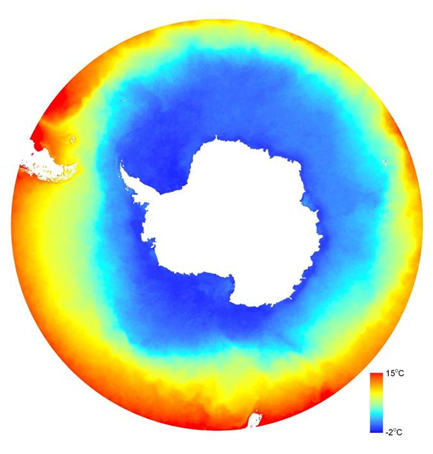
Figure 2.14 - Southern Ocean averaged SST for January from Aqua MODIS sensor.png
(
file
)
205 KB
Maintenance script
Uploaded by import script
1
14:31, 6 August 2014
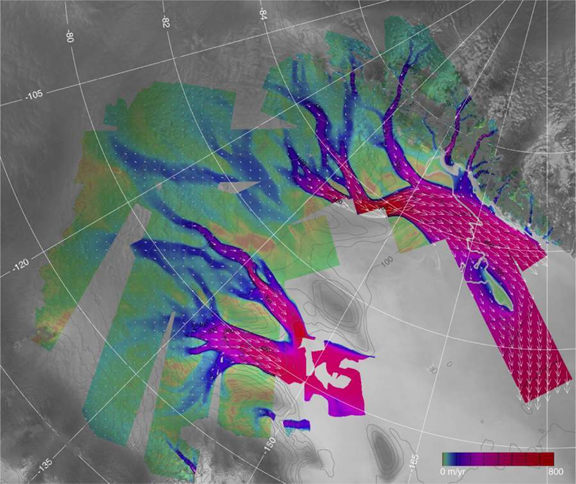
Figure 2.23 - Surface velocity of the Siple and Gould Coast regions of West Antarctica.png
(
file
)
441 KB
Maintenance script
Uploaded by import script
1
14:31, 6 August 2014
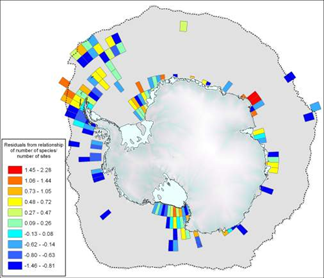
Figure 2.29 - Residual of regression of bivalve species richness against sampling effort, from SOMBASE.png
(
file
)
97 KB
Maintenance script
Uploaded by import script
1
14:31, 6 August 2014
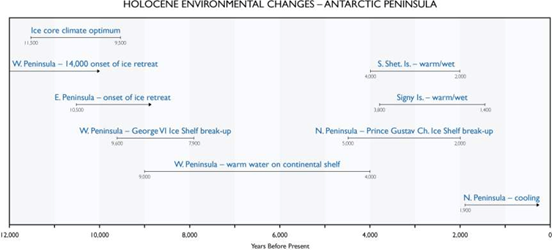
Figure 3.26 - Selected Holocene environmental changes - Antarctic Peninsula.png
(
file
)
68 KB
Maintenance script
Uploaded by import script
1
14:31, 6 August 2014
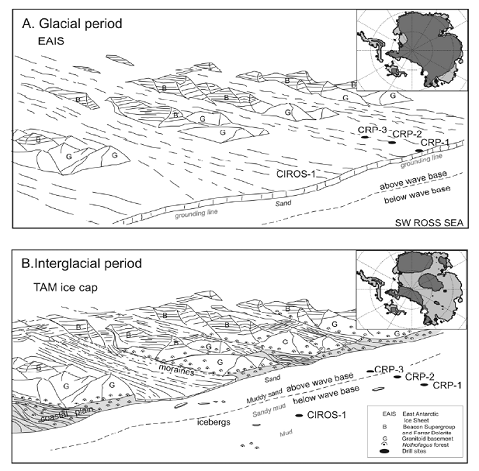
Figure 3.7 - View of the Victoria Land coast off Cape Roberts during Oligocene and early Miocene times.png
(
file
)
169 KB
Maintenance script
Uploaded by import script
1
14:31, 6 August 2014
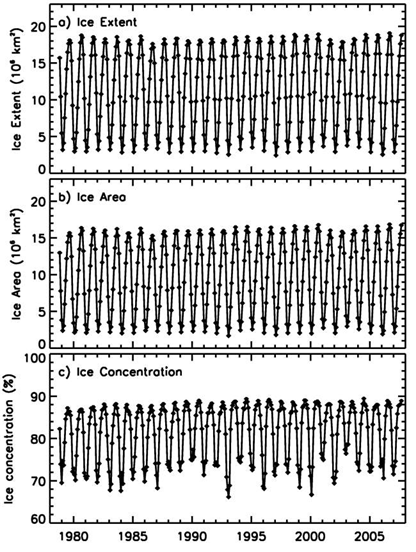
Figure 4.31 - Monthly extent, area and average ice concentration in the Southern Hemisphere.png
(
file
)
221 KB
Maintenance script
Uploaded by import script
1
14:31, 6 August 2014
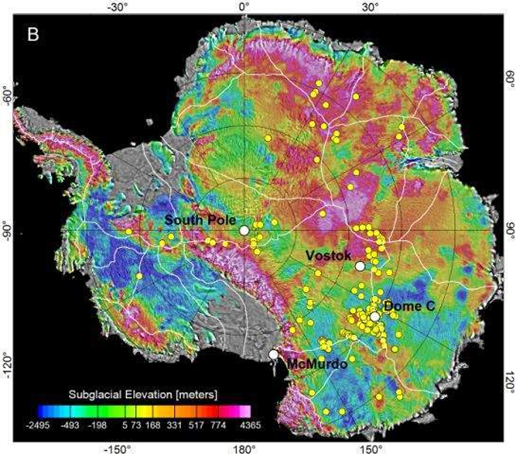
Figure 4.42 - Subglacial elevation and locations of Antarctic sub-glacial lakes.png
(
file
)
415 KB
Maintenance script
Uploaded by import script
1
14:31, 6 August 2014
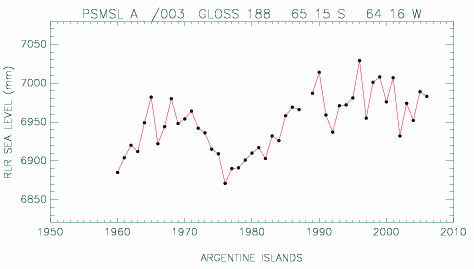
Figure 4.45 - PSMSL Argentine Islands Revised Local Reference (RLR) annual mean sea level time series.png
(
file
)
17 KB
Maintenance script
Uploaded by import script
1
14:31, 6 August 2014
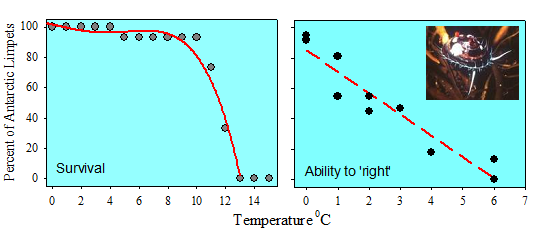
Figure 4.50 - Acute temperature influences on Antarctic invertebrates.png
(
file
)
28 KB
Maintenance script
Uploaded by import script
1
14:31, 6 August 2014
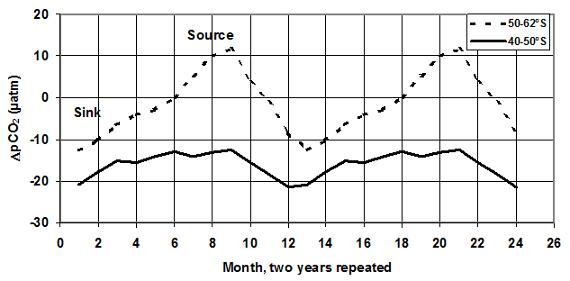
Figure 4.55 - The annual cycle atmosphere-ocean CO2 transport in the Southern Ocean.png
(
file
)
36 KB
Maintenance script
Uploaded by import script
1
14:31, 6 August 2014
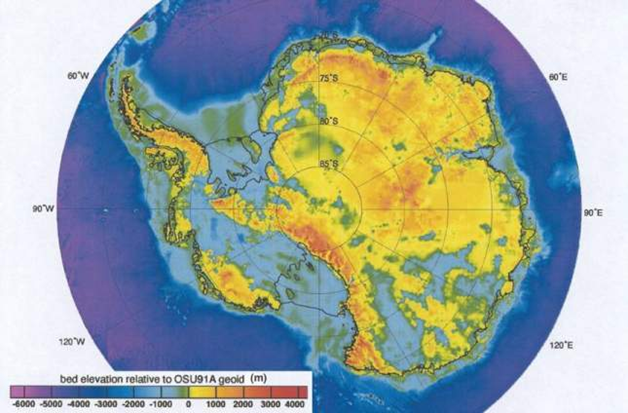
Figure 1.4 - Antarctic bed elevation.png
(
file
)
414 KB
Maintenance script
Uploaded by import script
1
14:31, 6 August 2014
Figure 2.12 - Example figure produced using the Southern Ocean Atlas.png
(
file
)
110 KB
Maintenance script
Uploaded by import script
1
14:31, 6 August 2014
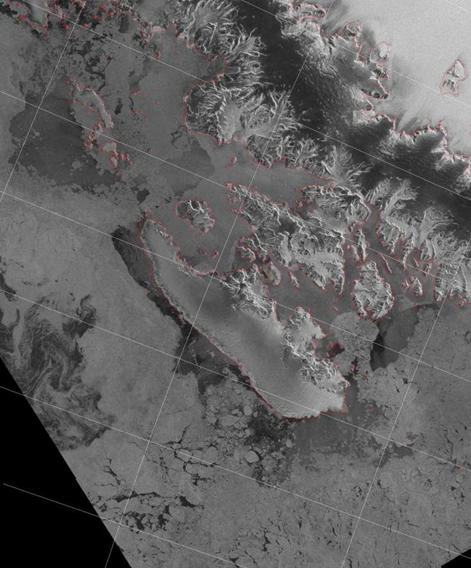
Figure 2.19 - Envisat ASAR image showing sea ice around Adelaide Island, West Antarctic Peninsula.png
(
file
)
353 KB
Maintenance script
Uploaded by import script
1
14:31, 6 August 2014
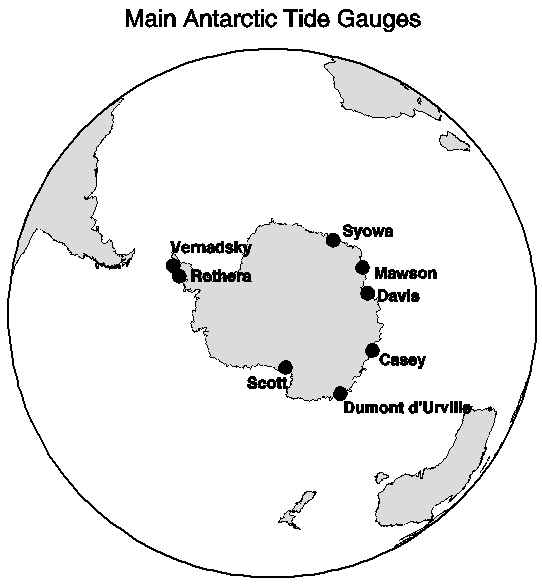
Figure 2.28 - Map of the main Antarctic tide gauges.png
(
file
)
12 KB
Maintenance script
Uploaded by import script
1
14:31, 6 August 2014
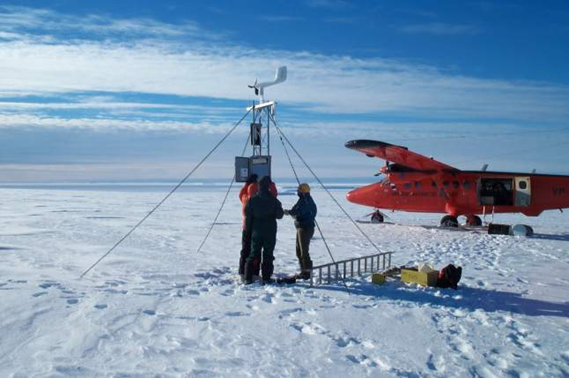
Figure 2.2 - Servicing the AWS at Butler Island.png
(
file
)
299 KB
Maintenance script
Uploaded by import script
1
14:31, 6 August 2014
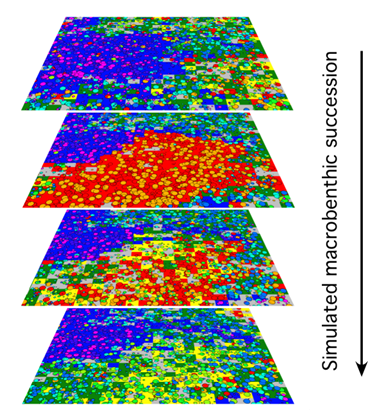
Figure 2.37 - Simulation of a benthic succession.png
(
file
)
227 KB
Maintenance script
Uploaded by import script
1
14:31, 6 August 2014
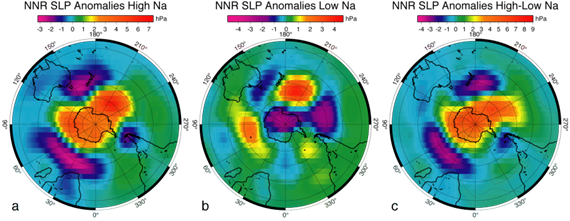
Figure 2.7 - Patterns of May-July NNR MSLP anomalies for high and low DSS sea salt aerosol years.png
(
file
)
151 KB
Maintenance script
Uploaded by import script
1
14:31, 6 August 2014
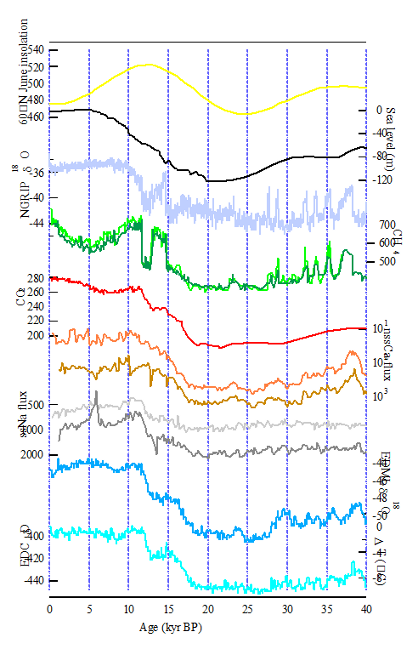
Figure 3.14 - Climate and environmental records of Termination I.png
(
file
)
125 KB
Maintenance script
Uploaded by import script
1
14:31, 6 August 2014
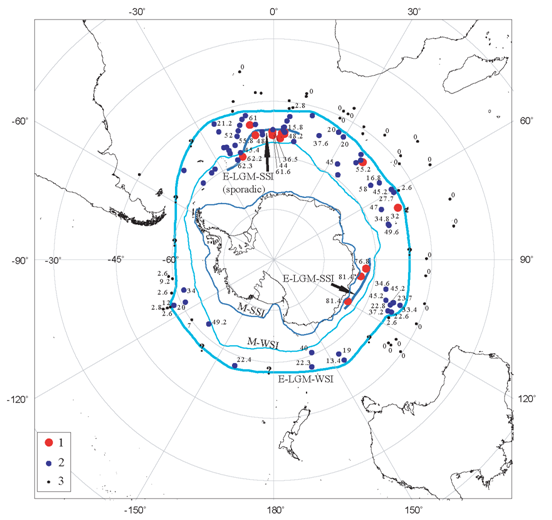
Figure 3.17 - Sea ice distribution at the Southern Ocean EPILOG-LGM time slice.png
(
file
)
145 KB
Maintenance script
Uploaded by import script
1
14:31, 6 August 2014
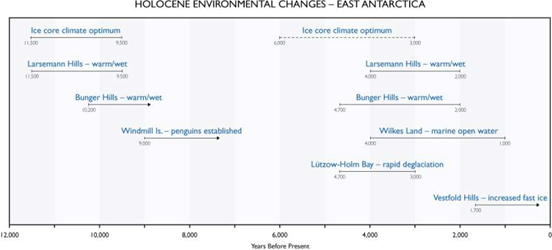
Figure 3.25 - Selected Holocene environmental changes - East Antarctica.png
(
file
)
68 KB
Maintenance script
Uploaded by import script
1
14:31, 6 August 2014
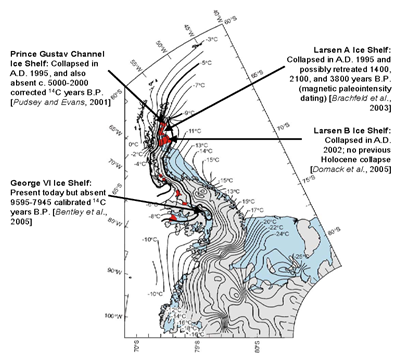
Figure 3.27 - Recent retreats of Antarctic Peninsula ice shelves and mean annual isotherms.png
(
file
)
127 KB
Maintenance script
Uploaded by import script
1
14:31, 6 August 2014
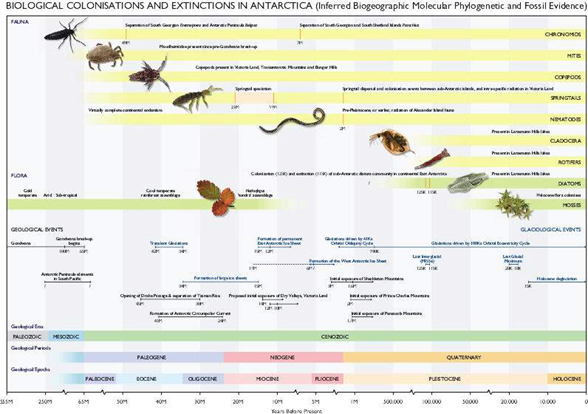
Figure 3.29 - Biological colonisations and extinctions in Antarctica since the break-up of Gondwana.png
(
file
)
250 KB
Maintenance script
Uploaded by import script
1
14:31, 6 August 2014
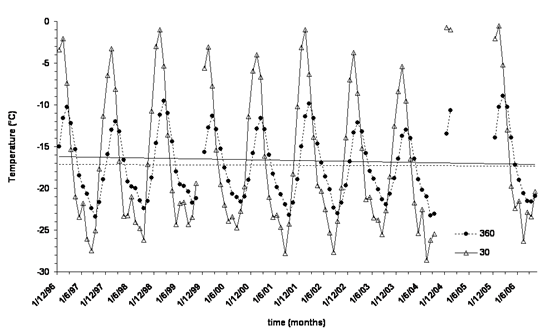
Figure 4.43 - Monthly mean temperatures at depths of 30cm and 360cm at Boulder Clay since 1996.png
(
file
)
68 KB
Maintenance script
Uploaded by import script
1
14:31, 6 August 2014
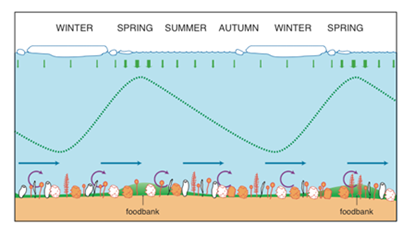
Figure 4.52 - Seasonal cycles of Antarctic shelf seabed organic matter transport processes.png
(
file
)
50 KB
Maintenance script
Uploaded by import script
1
14:31, 6 August 2014
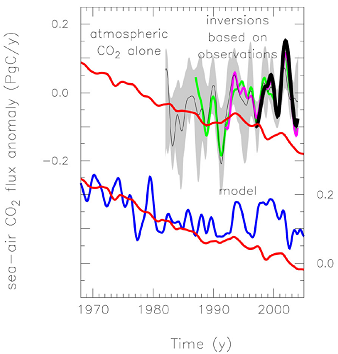
Figure 4.58 - Sea-air CO2 flux anomalies in the Southern Ocean.png
(
file
)
63 KB
Maintenance script
Uploaded by import script
1
14:31, 6 August 2014
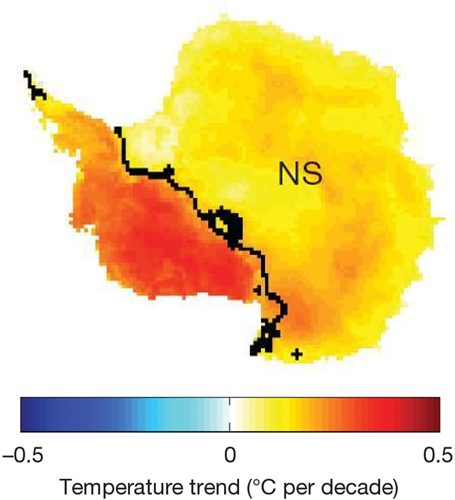
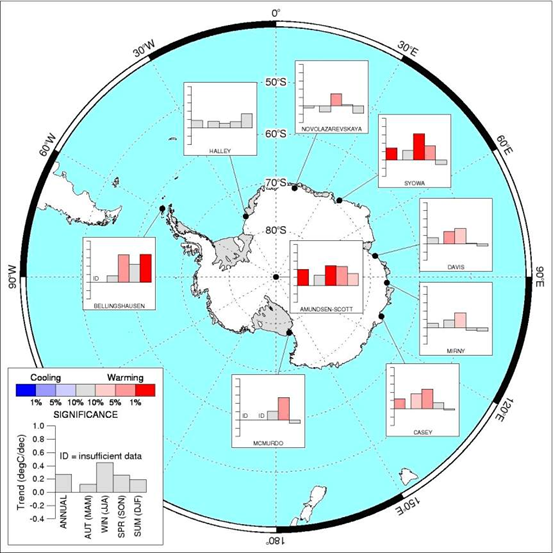
Figure 4.8c - Winter season temperature trends reconstructed using infrared satellite data.png
(
file
)
175 KB
Maintenance script
Uploaded by import script
1
14:31, 6 August 2014
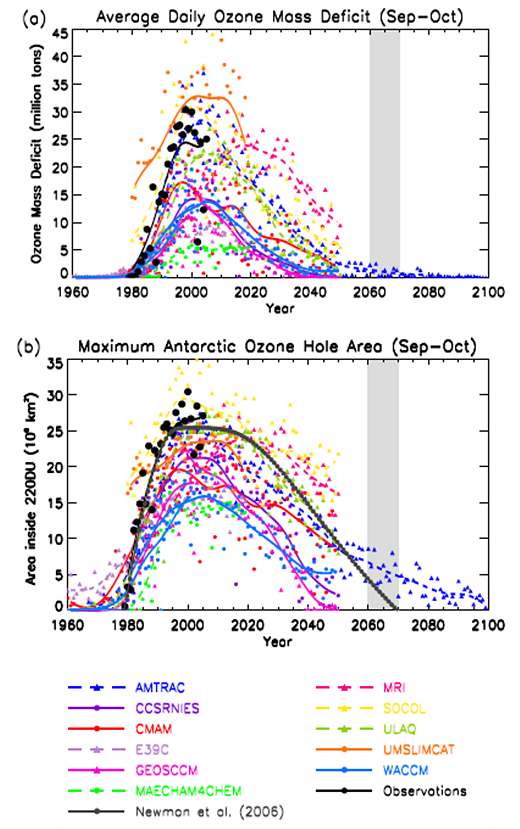
Figure 5.12 - Observations and predictions of average ozone mass deficit and maximum ozone hole area.png
(
file
)
237 KB
Maintenance script
Uploaded by import script
1
14:31, 6 August 2014
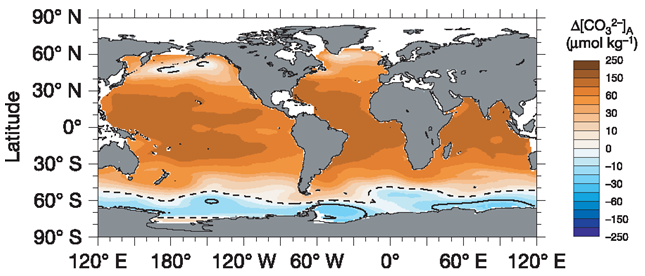
Figure 5.25 - Predicted aragonite saturation state of the surface ocean in the year 2100.png
(
file
)
136 KB
Maintenance script
Uploaded by import script
1
14:31, 6 August 2014
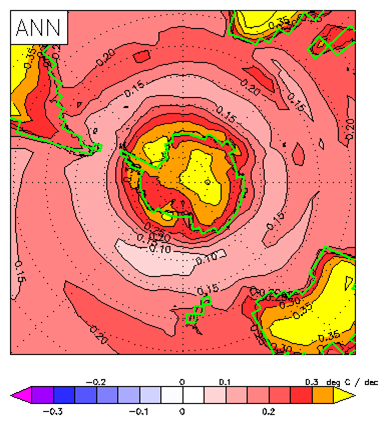
Figure 5.6 - Skin temperature trend over the Twenty First Century.png
(
file
)
129 KB
Maintenance script
Uploaded by import script
1
14:31, 6 August 2014
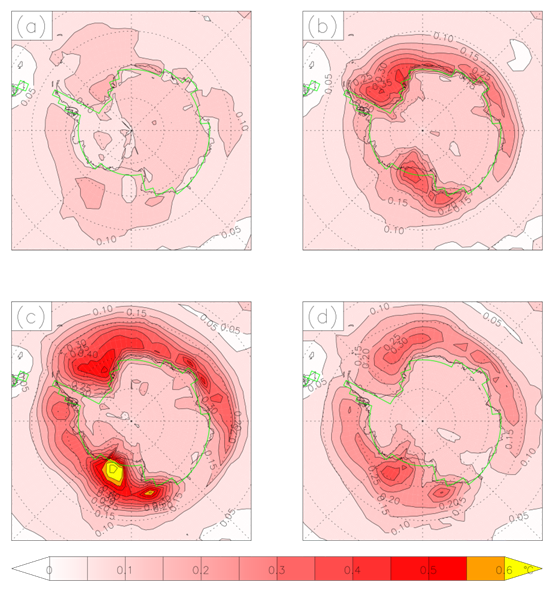
Figure 5.8 - Inter-model standard deviation of Twenty First Century skin temperature change by season.png
(
file
)
336 KB
Maintenance script
Uploaded by import script
1
14:31, 6 August 2014
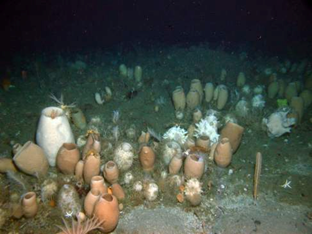
Figure 1.15 - A rich megabenthic community on the shelf of the southeastern Weddell Sea.png
(
file
)
125 KB
Maintenance script
Uploaded by import script
1
14:31, 6 August 2014
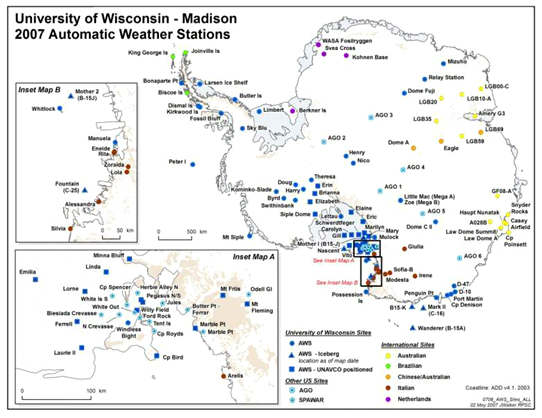
Figure 2.1 - Map of Antarctic AWS sites.png
(
file
)
225 KB
Maintenance script
Uploaded by import script
1
14:31, 6 August 2014
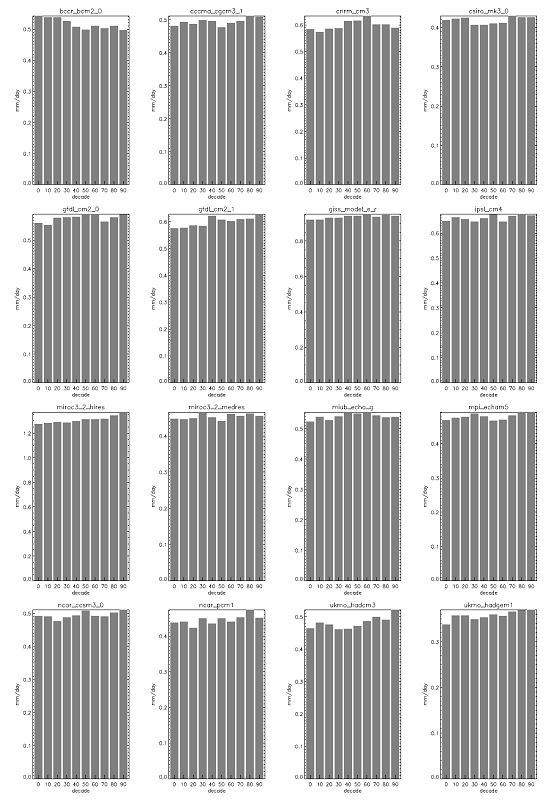
Figure 2.32 - Simulated 20th century Antarctic precipitation in 16 AR4 climate models.png
(
file
)
98 KB
Maintenance script
Uploaded by import script
1
14:31, 6 August 2014
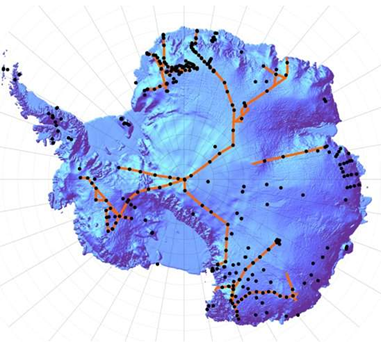
Figure 2.4 - Map of Antarctic ice cores and ground penetrating radar routes.png
(
file
)
206 KB
Maintenance script
Uploaded by import script
1
14:31, 6 August 2014
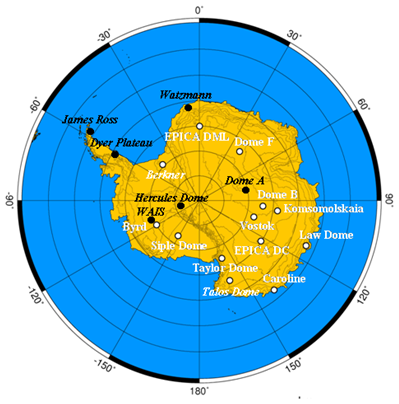
Figure 3.15 - Map of Antarctica showing some deep ice core sites.png
(
file
)
131 KB
Maintenance script
Uploaded by import script
1
14:31, 6 August 2014
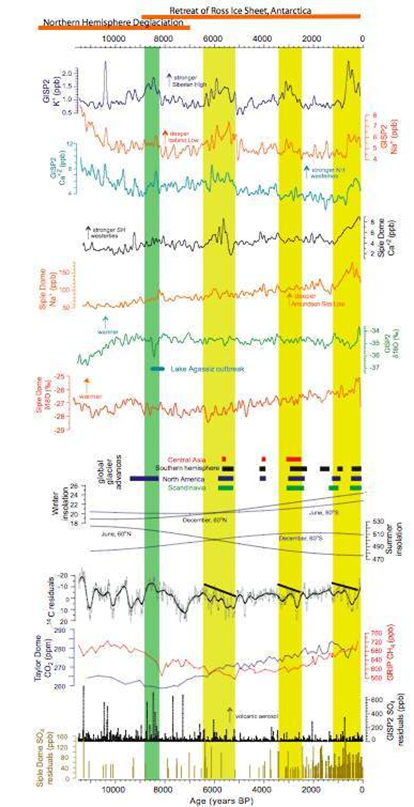
Figure 3.19a - Antarctic and Greenland holocene climate change compared using ice core data.png
(
file
)
400 KB
Maintenance script
Uploaded by import script
1
14:31, 6 August 2014
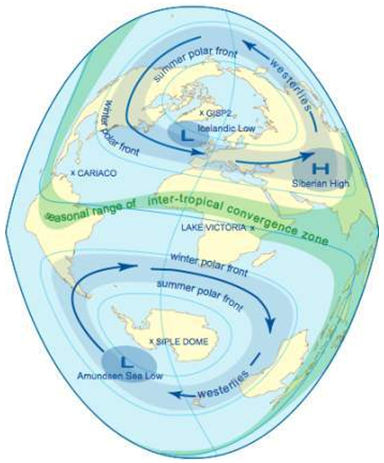
Figure 3.19b - Map showing GISP2, Siple Dome and key atmospheric circulation features.png
(
file
)
251 KB
Maintenance script
Uploaded by import script
1
14:31, 6 August 2014
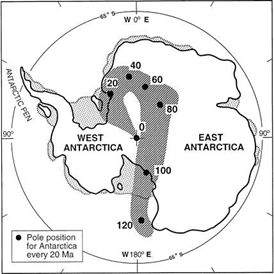
Figure 3.2 - Apparent polar wander path for East Antarctica over the last 120 million years.png
(
file
)
72 KB
Maintenance script
Uploaded by import script
1
14:31, 6 August 2014
Figure 4.10 - Annual and seasonal 500hPa temperature trends for 1971-2003.png
(
file
)
271 KB
Maintenance script
Uploaded by import script
1
14:31, 6 August 2014
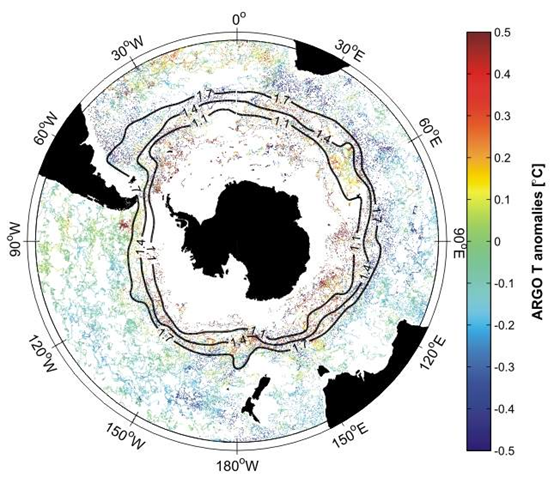
Figure 4.23 - ARGO temperature anomalies and ACC fronts.png
(
file
)
371 KB
Maintenance script
Uploaded by import script
1
14:31, 6 August 2014
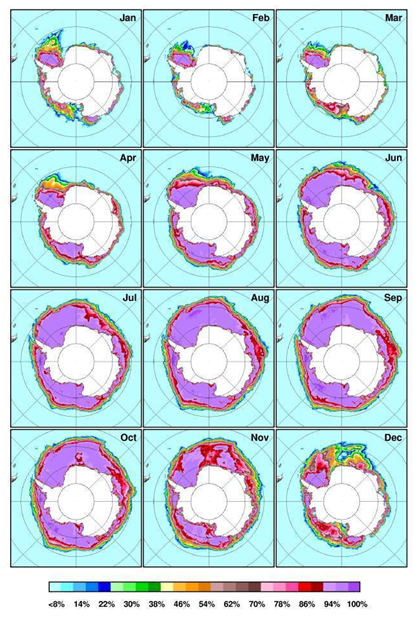
Figure 4.30 - Monthly climatology of the sea ice concentration from AMSR-E data (2002-2007).png
(
file
)
434 KB
Maintenance script
Uploaded by import script
1
14:31, 6 August 2014
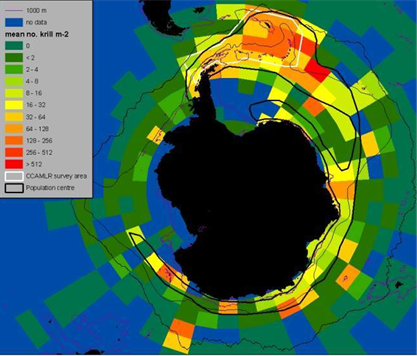
Figure 4.46 - Circumpolar distribution of Antarctic krill based on standardised data from KRILLBASE.png
(
file
)
207 KB
Maintenance script
Uploaded by import script
1
14:31, 6 August 2014
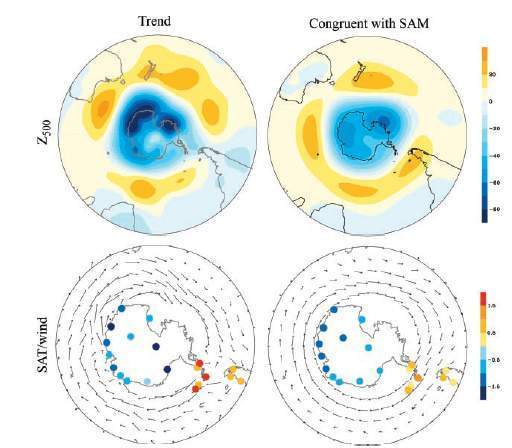
Figure 4.9 - Trends in December-May Z500, surface temperature and 925hPa winds, and SAM contribution.png
(
file
)
269 KB
Maintenance script
Uploaded by import script
1
14:31, 6 August 2014
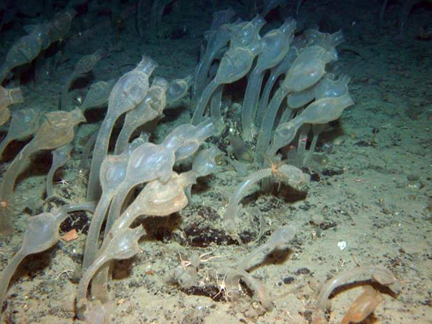
Figure 5.30 - Ascidians observed after the disintegration of the Larsen B ice shelf.png
(
file
)
294 KB
Maintenance script
Uploaded by import script
1
14:31, 6 August 2014
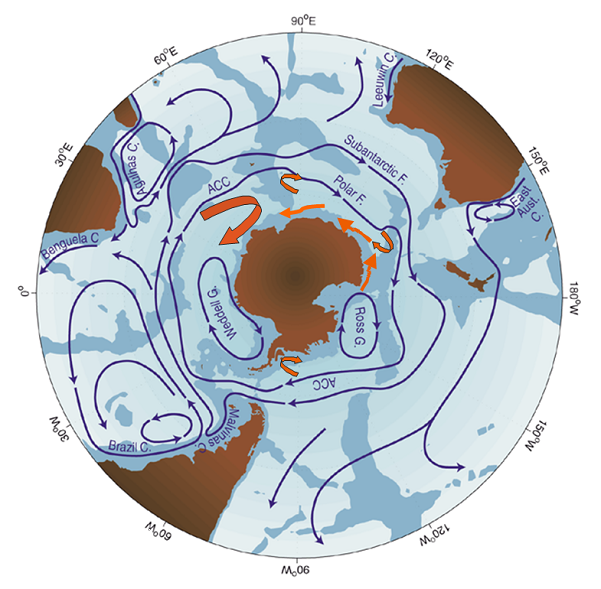
Figure 1.10 - Major currents south of 20S.png
(
file
)
308 KB
Maintenance script
Uploaded by import script
1
14:31, 6 August 2014
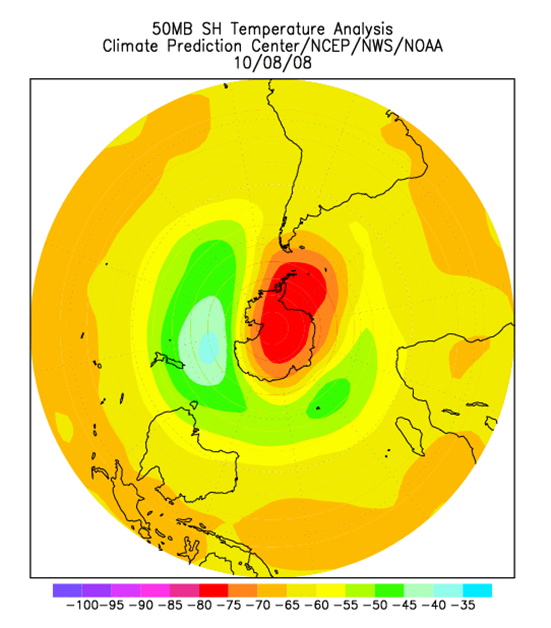
Figure 1.13 - The Antarctic polar vortex in mid-winter.png
(
file
)
189 KB
Maintenance script
Uploaded by import script
1
14:31, 6 August 2014
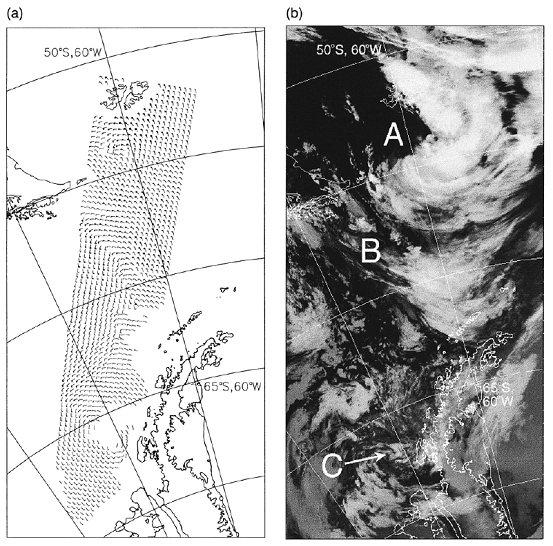
Figure 2.18 - Southern Ocean scatterometer and thermal infrared data acquired on 15 Jan 1995.png
(
file
)
376 KB
Maintenance script
Uploaded by import script
1
First page
Previous page
Next page
Last page
Navigation menu
Personal tools
Log in
Namespaces
Special page
Variants
Views
Actions
Search
Navigation
Home
Contents
About ACCE
Key points
The Antarctic environment in the global system
Observations, data accuracy and tools
The pre-instrumental period
The instrumental period
The next 100 years
Recommendations
Help
Help
Tools
Special pages
Printable version


_annual_mean_sea_level_time_series.png)


.png)


