Search results
Create the page "Ozone" on this wiki! See also the search results found.
Page title matches
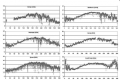
File:Figure 4.18 - Surface ozone by day for Halley, MacMurdo, Neumayer, Sanae, Syowa and South Pole.png ...A.E., Labuschagne, C., Anlauf, K. and Hayden, K. 2007. A review of surface ozone in the polar regions, ''Atmos. Env.'', '''41''', 5138-5161, doi:10.1016/j.a(538 × 358 (131 KB)) - 15:30, 6 August 2014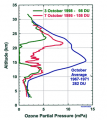
File:Figure 4.14 - South pole ozone profiles.png ...showing the progressive thinning of the ozone layer in late spring as the ozone hole developed during the 1980s and 1990s (courtesy NOAA/CMDL).(340 × 381 (73 KB)) - 15:30, 6 August 2014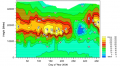
File:Figure 4.15 - The annual cycle of ozone in 2006 at Neumayer.png The annual cycle of ozone (nbar) in 2006 at Neumayer, 71°S (courtesy Alfred Wegener Institute).(551 × 303 (130 KB)) - 15:31, 6 August 2014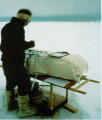
File:Figure 2.3 - The Dobson ozone spectrophotometer at Halley.png ...during an intercomparison of instruments prior to the announcement of the ozone hole in 1985 (courtesy British Antarctic Survey).(320 × 376 (239 KB)) - 15:31, 6 August 2014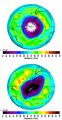
File:Figure 4.16 - Aura satellite Ozone Monitoring Instrument measurements on 14 Sep 2006 and 10 Oct 2006.png ...covering all of Antarctica. Bottom – on 10 October 2006, showing the ozone hole extending towards South America. (courtesy NASA/GSFC).(356 × 688 (176 KB)) - 15:31, 6 August 2014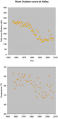
File:Figure 4.17 - Halley October mean total ozone and November mean 100hPa temperature by year.png ...cators of any large reduction in the chlorine and bromine gases that cause ozone loss.(330 × 678 (96 KB)) - 15:31, 6 August 2014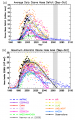
File:Figure 5.12 - Observations and predictions of average ozone mass deficit and maximum ozone hole area.png ...essment of Ozone Depletion: 2006, World Meteorological Organisation Global Ozone Research and Monitoring Project – Report No. 50, Geneva, Switzerland(520 × 829 (237 KB)) - 15:31, 6 August 2014- ==Ozone== ...ne layer – hence its other name, the stratosphere. Above Europe, the ozone layer is typically from 13 to 50 km altitude. In Antarctica it is a few kil59 KB (9,046 words) - 15:33, 6 August 2014


Page text matches
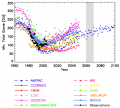
File:Figure 5.11 - Observations and model predictions of minimum September to October total column ozone.png ...essment of Ozone Depletion: 2006, World Meteorological Organisation Global Ozone Research and Monitoring Project – Report No. 50, Geneva, Switzerland(543 × 488 (113 KB)) - 15:30, 6 August 2014File:Figure 4.18 - Surface ozone by day for Halley, MacMurdo, Neumayer, Sanae, Syowa and South Pole.png ...A.E., Labuschagne, C., Anlauf, K. and Hayden, K. 2007. A review of surface ozone in the polar regions, ''Atmos. Env.'', '''41''', 5138-5161, doi:10.1016/j.a(538 × 358 (131 KB)) - 15:30, 6 August 2014File:Figure 4.14 - South pole ozone profiles.png ...showing the progressive thinning of the ozone layer in late spring as the ozone hole developed during the 1980s and 1990s (courtesy NOAA/CMDL).(340 × 381 (73 KB)) - 15:30, 6 August 2014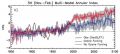
File:Figure 5.5 - Mean regression of the leading EOF of ensemble mean SH sea level pressure.png ...filtered version of the mean with ozone forcing; the blue line is without ozone forcing. The grey shading represents the inter-model spread at the 95% conf(542 × 244 (146 KB)) - 15:31, 6 August 2014File:Figure 4.15 - The annual cycle of ozone in 2006 at Neumayer.png The annual cycle of ozone (nbar) in 2006 at Neumayer, 71°S (courtesy Alfred Wegener Institute).(551 × 303 (130 KB)) - 15:31, 6 August 2014File:Figure 2.3 - The Dobson ozone spectrophotometer at Halley.png ...during an intercomparison of instruments prior to the announcement of the ozone hole in 1985 (courtesy British Antarctic Survey).(320 × 376 (239 KB)) - 15:31, 6 August 2014File:Figure 4.16 - Aura satellite Ozone Monitoring Instrument measurements on 14 Sep 2006 and 10 Oct 2006.png ...covering all of Antarctica. Bottom – on 10 October 2006, showing the ozone hole extending towards South America. (courtesy NASA/GSFC).(356 × 688 (176 KB)) - 15:31, 6 August 2014File:Figure 4.17 - Halley October mean total ozone and November mean 100hPa temperature by year.png ...cators of any large reduction in the chlorine and bromine gases that cause ozone loss.(330 × 678 (96 KB)) - 15:31, 6 August 2014File:Figure 5.12 - Observations and predictions of average ozone mass deficit and maximum ozone hole area.png ...essment of Ozone Depletion: 2006, World Meteorological Organisation Global Ozone Research and Monitoring Project – Report No. 50, Geneva, Switzerland(520 × 829 (237 KB)) - 15:31, 6 August 2014- ...S., Fogt, R.L., Nielsen, J.E. and Neff, W.D. 2008. Impact of stratospheric ozone hole recovery on Antarctic climate, ''Geophysical Research Letters'', '''355 KB (788 words) - 16:49, 6 August 2014
- ##[[Meteorological and ozone observing in the Antarctic]]4 KB (504 words) - 17:51, 21 August 2014
- ...009. Non‐annular atmospheric circulation change induced by stratospheric ozone depletion and its role in the recent increase of Antarctic sea ice extent,22 KB (3,536 words) - 13:25, 22 August 2014
- ==Antarctic stratospheric ozone over the next 100 years== ...t because of the more complex stratospheric dynamics near the poles, polar ozone is best simulated by 3-D models. For comparison with past measurements, Che27 KB (4,305 words) - 16:22, 6 August 2014
- ==Antarctic stratospheric ozone in the instrumental period== ...showing the progressive thinning of the ozone layer in late spring as the ozone hole developed during the 1980s and 1990s (courtesy NOAA/CMDL).]]43 KB (6,788 words) - 17:07, 22 August 2014
- ..., such as the variability in the ocean circulation, the development of the ozone hole and the large natural variability of the high latitude climate, all af54 KB (8,177 words) - 13:38, 22 August 2014
- ...dell, D.T. and Schmidt, G.A. 2004. Southern hemisphere climate response to ozone changes and greenhouse gas increases, ''Geophys. Res. Lett.'', '''31''', L1 ...filtered version of the mean with ozone forcing; the blue line is without ozone forcing. The grey shading represents the inter-model spread at the 95% conf29 KB (4,462 words) - 17:11, 22 August 2014
- ...bserved are reproduced in global climate models forced by a combination of ozone depletion, and increasing greenhouse gas concentrations (Arblaster and Meeh13 KB (1,943 words) - 15:33, 6 August 2014
- ...eric warming over the East Antarctic interior is projected in most GCMs as ozone depletion is reversed, but there may not be a straightforward connection be ...the Southern Ocean, driven by the increased pressure gradient between the ozone hole cooled Antarctic and the warmer Southern Hemisphere mid-latitudes. The26 KB (4,124 words) - 14:04, 22 August 2014
- ...ef>). The impact of solar forcing (via UV induced changes in stratospheric ozone concentration) on the southern circumpolar westerlies at the edge of the po ...westerlies. Based on this analogue (Dixon et al., In Review) propose that ozone hole recovery and continued greenhouse gas warming could trigger yet anothe39 KB (5,945 words) - 15:33, 6 August 2014
- ...he estimation of the effects of enhanced UV radiation due to stratospheric ozone depletion. UV induced changes in algal zonation and biodiversity make chang11 KB (1,587 words) - 15:33, 6 August 2014

