File:Figure 4.23 - ARGO temperature anomalies and ACC fronts.png
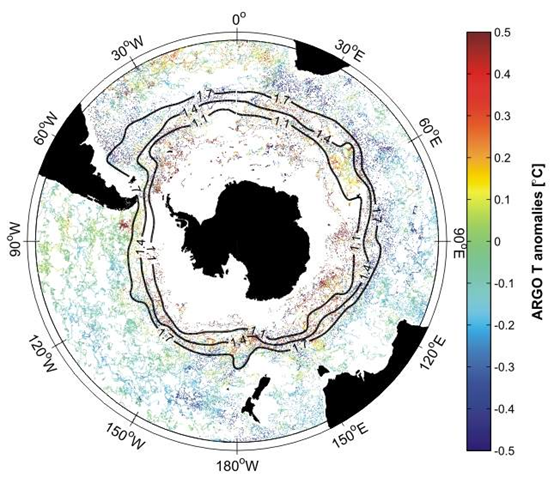
Temperature differences between measurements from Argo floats deployed after 2001, presented as dots, and the climatological mean from CARS in the density layers of the ACC show an increase of potential temperature of the water masses on the southward flank of the ACC and a freshening on the northward side. On surfaces of constant densities freshening becomes visible as cooling, since the density loss by less salt is compensated by a density gain due to colder temperature. The major fronts representing ACC branches are displayed as dynamic height contours where the 1.4-m-dynamic-height contour is related to the Polar Front and 1.7-m one to the Subantarctic Front (Böning et al., 2008[1])
- ↑ Böning, C. W., A. Dispert, M. Visbeck, S. R. Rintoul, and F. Schwarzkopf, 2008. Observed multi-decadal ocean warming and density trends across the Antarctic Circumpolar Current, Submitted.
File history
Click on a date/time to view the file as it appeared at that time.
| Date/Time | Thumbnail | Dimensions | User | Comment | |
|---|---|---|---|---|---|
| current | 15:31, 6 August 2014 | | 554 × 477 (371 KB) | Maintenance script (Talk) | Uploaded by import script |
- You cannot overwrite this file.
File usage
The following page links to this file: