File:Figure 3.11 - Insolation, EPICA Dome C delta-D and ice core dust, and marine oxygen isotope record.png
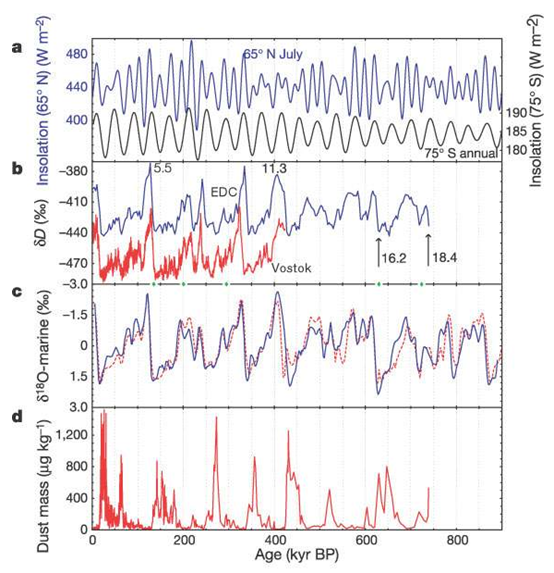
(a) Insolation records. Upper blue curve (left axis), mid-July insolation at 65°N; lower black curve (right axis), annual mean insolation at 75°S, the latitude of the Dome C ice core. (b) D from EPICA Dome C (3,000-yr averages). Vostok ice core D (red) is shown for comparison and some Marine Isotope Stage (MIS) numbers are indicated; the locations of the control windows (below 800-m depth) used to make the timescale are shown as diamonds on the x axis. (c) Marine oxygen isotope record. The solid blue line is the tuned low-latitude stack of drill sites MD900963 and ODP677; to indicate the uncertainties in the marine records we also show (dashed red line) another record, which is a stack of seven sites for the last 400 ka but consisting only of ODP drill site 677 for the earlier period. Both records have been normalized to their long-term average. (d) Dust from the EPICA Dome C ice core (EPICA, 2004[1]).
- ↑ EPICA community members. 2004. Eight glacial cycles from an Antarctic ice core, Nature, 429, 623-628.
File history
Click on a date/time to view the file as it appeared at that time.
| Date/Time | Thumbnail | Dimensions | User | Comment | |
|---|---|---|---|---|---|
| current | 15:30, 6 August 2014 | | 554 × 573 (333 KB) | Maintenance script (Talk) | Uploaded by import script |
- You cannot overwrite this file.
File usage
The following page links to this file: