File:Figure 5.11 - Observations and model predictions of minimum September to October total column ozone.png
From ACCE
No higher resolution available.
Figure_5.11_-_Observations_and_model_predictions_of_minimum_September_to_October_total_column_ozone.png (543 × 488 pixels, file size: 113 KB, MIME type: image/png)
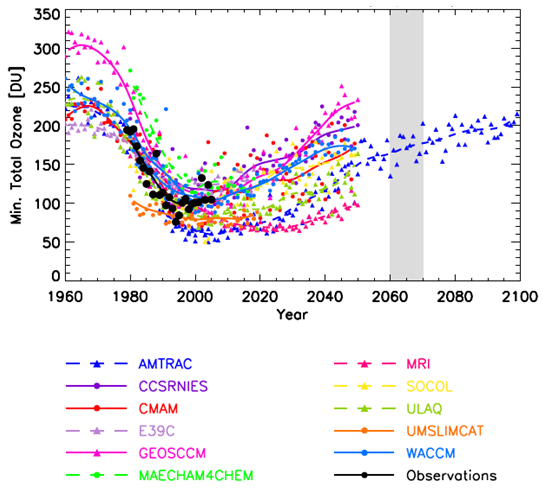
Minimum total column ozone in September to October predicted by various models, plus observations from the National Institute of Water and Atmosphere Research (NIWA) total ozone database in New Zealand (Bodeker et al., 2005[1]). Solid and dashed curves show smoothed values. Light gray shading shows when CFCs and halons are expected to return to 1980 values. Adapted from WMO (2007[2]).
- ↑ Bodeker, G.E., Shiona, H. and Eskes, H. 2005. Indicators of Antarctic ozone depletion, Atmos. Chem. Phys., 5, 2603-2615.
- ↑ WMO, 2007. Scientific Assessment of Ozone Depletion: 2006, World Meteorological Organisation Global Ozone Research and Monitoring Project – Report No. 50, Geneva, Switzerland (2007).
File history
Click on a date/time to view the file as it appeared at that time.
| Date/Time | Thumbnail | Dimensions | User | Comment | |
|---|---|---|---|---|---|
| current | 15:30, 6 August 2014 | | 543 × 488 (113 KB) | Maintenance script (Talk) | Uploaded by import script |
- You cannot overwrite this file.
File usage
The following page links to this file: