File:Figure 4.9 - Trends in December-May Z500, surface temperature and 925hPa winds, and SAM contribution.png
From ACCE
No higher resolution available.
Figure_4.9_-_Trends_in_December-May_Z500,_surface_temperature_and_925hPa_winds,_and_SAM_contribution.png (512 × 448 pixels, file size: 269 KB, MIME type: image/png)
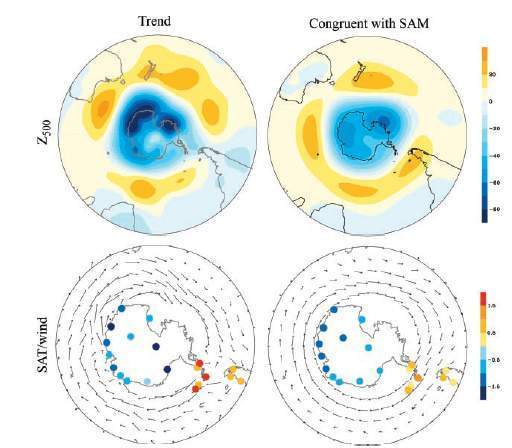
December-May trends (left) and the contribution of the SAM to the trends (right). Top, 22-year (1979-2000) linear trends in 500 hPa geopotential height. Bottom: 32-year (1969-2000) linear trends in surface temperature and 22-year (1979-2000) linear trends in 925 hPa winds. Shading is drawn at 10 m per 30 years for 500 hPa height and at increments of 0.5º K per 30 years for surface temperature. The longest vector corresponds to about 4 m/s. From Thompson and Solomon (2002[1]).
- ↑ Thompson, D. and Solomon, S. 2002. Interpretation of recent southern hemisphere climate change, Science, 296(5569), 895-899.
File history
Click on a date/time to view the file as it appeared at that time.
| Date/Time | Thumbnail | Dimensions | User | Comment | |
|---|---|---|---|---|---|
| current | 15:31, 6 August 2014 | | 512 × 448 (269 KB) | Maintenance script (Talk) | Uploaded by import script |
- You cannot overwrite this file.
File usage
The following page links to this file: