File:Figure 4.8b - Linear trends of annual mean surface air temperature for 1958-2002.png
From ACCE
No higher resolution available.
Figure_4.8b_-_Linear_trends_of_annual_mean_surface_air_temperature_for_1958-2002.png (554 × 631 pixels, file size: 458 KB, MIME type: image/png)
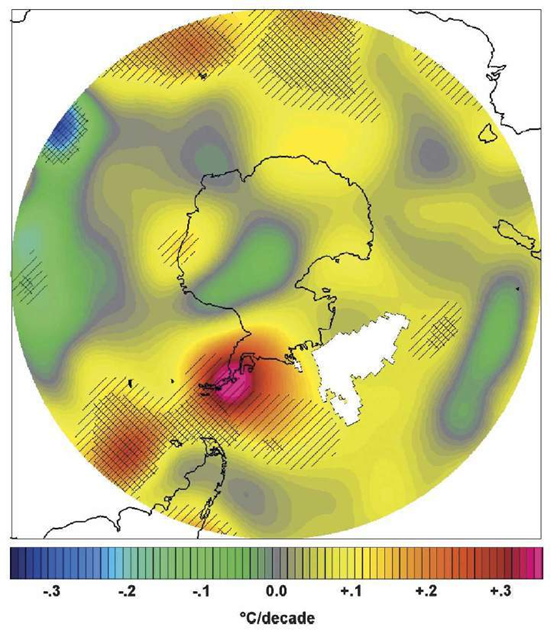
Linear trends of annual mean surface air temperature (°C /dec) for the period 1958–2002. Greens and blues denote cooling; yellows and reds denote warming. Significant trends are indicated by hatching (95% = single hatching; 99% = crosshatching). From Chapman and Walsh (2007[1])
- ↑ Chapman, W.L. and Walsh, J. E. 2007. A Synthesis of Antarctic Temperatures, Journal of Climate, 20, 4096-4117.
File history
Click on a date/time to view the file as it appeared at that time.
| Date/Time | Thumbnail | Dimensions | User | Comment | |
|---|---|---|---|---|---|
| current | 15:30, 6 August 2014 | | 554 × 631 (458 KB) | Maintenance script (Talk) | Uploaded by import script |
- You cannot overwrite this file.
File usage
The following page links to this file: