File:Figure 4.20 - Mean aerosol optical depth (500 nm) by month.png
From ACCE
No higher resolution available.
Figure_4.20_-_Mean_aerosol_optical_depth_(500_nm)_by_month.png (553 × 414 pixels, file size: 180 KB, MIME type: image/png)
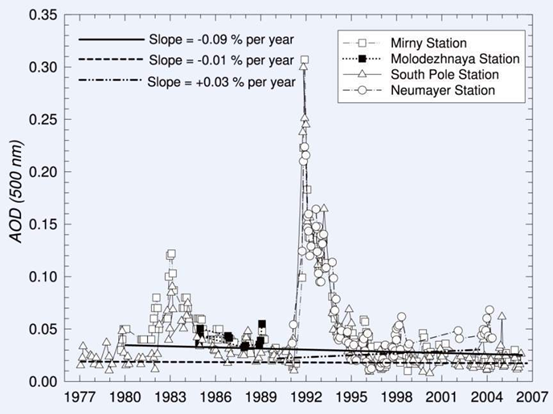
Time sequence of the monthly mean values of AOD (500 nm) derived from (1) filtered actinometer and sun photometer at Mirny from 1979/80 to 2005/06 (open squares), and at Molodezhnaya from 1985 to 1989 (solid squares); (2) filtered pyrheliometer and sun photometer at South Pole from 1977 to 2006 (open triangles); and from sun photometer measurements at Neumayer from 1991 to 2004 (open circles). The regression lines, defined separately for the Mirny, South Pole and Neumayer data sets without volcanic data are drawn to show the long-term trend of background aerosol extinction in Antarctica. (Figure 14 of Tomasi et al., 2007[1])
- ↑ Tomasi, C. and 30 collaborators. 2007. Aerosols on polar regions: An historical overview on the basis of optical depth and in-situ observations, J. Geophys. Res., 112, D16205, doi: 10.1029/2007JD008432.
File history
Click on a date/time to view the file as it appeared at that time.
| Date/Time | Thumbnail | Dimensions | User | Comment | |
|---|---|---|---|---|---|
| current | 15:30, 6 August 2014 | | 553 × 414 (180 KB) | Maintenance script (Talk) | Uploaded by import script |
- You cannot overwrite this file.
File usage
The following page links to this file:
_by_month.png&oldid=13)
_by_month.png)
_by_month.png&action=edit&redlink=1)
_by_month.png&action=edit)
_by_month.png&action=history)
_by_month.png)
_by_month.png)
_by_month.png&printable=yes)
_by_month.png&oldid=13)
_by_month.png&action=info)