File:Figure 3.21 - Reconstructed temperatures and ice core reconstructed atmospheric circulation systems.png
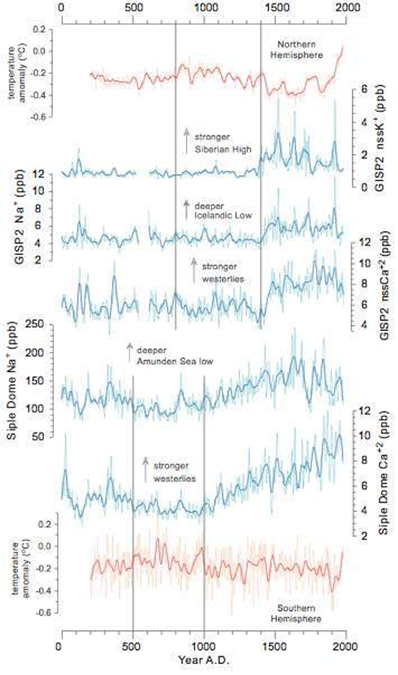
Northern and Southern Hemisphere reconstructed temperatures (in red from Mann and Jones, 2003[1]) and ice core reconstructed atmospheric circulation systems (in blue from Mayewski and Maasch, 2006[2]) (Icelandic Low, Siberian High, Northern and Southern Hemisphere westerlies, and Amundsen Sea Low). Data are presented with less than 10-yr signal (light line) extracted to approximate the original annual to multi-annual series and with the less than 30-yr signal (dark line) extracted series to facilitate examination at decadal scales. Vertical lines refer to onset for temperature change (earliest refers to Medieval Warm Period and second to Little Ice Age, the two most recent analogues for naturally warm and cool temperatures, respectively). These ice cores were chosen because they are the highest resolution Antarctic and Greenland ice core data of their kind available. Figure taken from Mayewski and Maasch (2006[2]).
- ↑ Mann, M. E. and Jones, P.D. 2003. Global surface temperatures over the past two millennia, Geophysical Research Letters, 30, doi: 10.129/2003GL017814.
- ↑ 2.0 2.1 Mayewski, P.A. and Maasch, K. 2006. Recent warming inconsistent with natural association between temperature and atmospheric circulation over the last 2000 years. Climate of the Past (Discussions) http://www.copernicus.org/EGU/cp/cpd/2/327/cpd-2-327.htm.
File history
Click on a date/time to view the file as it appeared at that time.
| Date/Time | Thumbnail | Dimensions | User | Comment | |
|---|---|---|---|---|---|
| current | 15:31, 6 August 2014 | | 398 × 675 (293 KB) | Maintenance script (Talk) | Uploaded by import script |
- You cannot overwrite this file.
File usage
The following page links to this file: