File:Figure 3.18 - February SSTs and sea ice duration in core SO136-111 and insolation curves.png
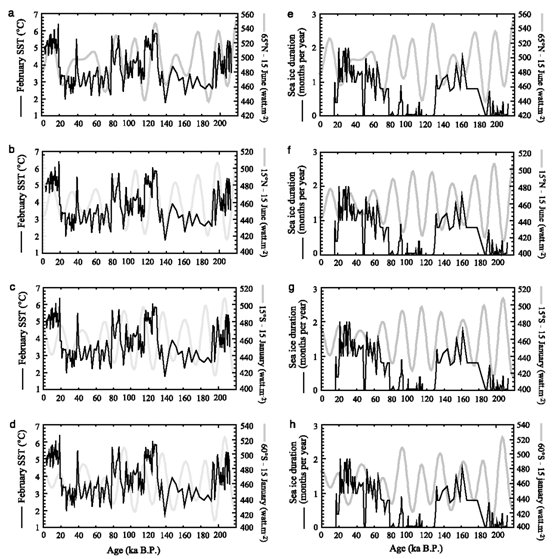
Comparison of February SSTs and sea ice duration in core SO136-111 with insolation curves. Parameters estimated by Modern Analog Technique 5201/31 are represented by black lines; insolation curves are represented by grey lines. (a) SSTs versus insolation at 65°N for the 15th of June, (b) SSTs versus insolation at 15°N for the 15th of June, (c) SSTs versus insolation at 15°S for the 15th of January, (d) SSTs versus insolation at 60°S for the 15th of January, (e) sea ice cover versus insolation at 65°N for the 15th of June, (f) sea ice cover versus insolation at 15°N for the 15th of June, (g) sea ice cover versus insolation at 15°S for the 15th of January, (h) sea ice cover versus insolation at 60°S for the 15th of January (Crosta et al., 2004[1]).
- ↑ Crosta, X., Sturm, A., Armand, L. and Pichon, J.J. 2004. Late Qaternary sea ice history in the Indian sector of the Southern Ocean as record by diatom assemblages, Marine Micropaleontology, 50, 209-223.
File history
Click on a date/time to view the file as it appeared at that time.
| Date/Time | Thumbnail | Dimensions | User | Comment | |
|---|---|---|---|---|---|
| current | 15:31, 6 August 2014 | | 553 × 559 (212 KB) | Maintenance script (Talk) | Uploaded by import script |
- You cannot overwrite this file.
File usage
The following page links to this file: