File:Figure 2.35 - Modelled and observed surface velocities for Pine Island and Thwaites Glaciers.png
From ACCE
No higher resolution available.
Figure_2.35_-_Modelled_and_observed_surface_velocities_for_Pine_Island_and_Thwaites_Glaciers.png (361 × 401 pixels, file size: 338 KB, MIME type: image/png)
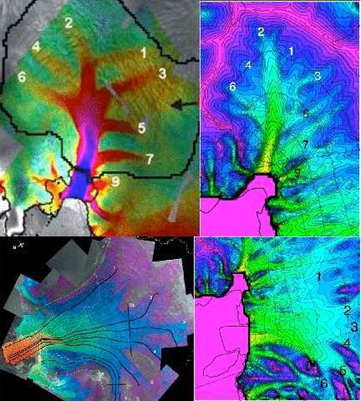
Comparison of model and observed surface velocities for Pine Island Glacier (upper right and left (Rignot et al., 2004b[1]), respectively) and for Thwaites Glacier (lower right and left (Lang et al., 2004[2]), respectively).
- ↑ Rignot, E., Thomas, R., Kanagaratnam, P., Casassa, G., Frederick, E., Gogineni, P., Krabill, W., Rivera, A., Russell, R., Sonntag, J., Swift, R. and Yungel, J. 2004b. Improved estimate of the mass balance of glaciers draining into the Amundsen Sea of West Antarctica from CECS/NASA 2002 campaign, Annals of Glaciology, 39, 231-237.
- ↑ Lang, O., Rabus, B. and Dech, S. 2004. Velocity map of the Thwaites Glacier catchment, West Antarctica, Journal of Glaciology, 50(168), 46--56.
File history
Click on a date/time to view the file as it appeared at that time.
| Date/Time | Thumbnail | Dimensions | User | Comment | |
|---|---|---|---|---|---|
| current | 15:31, 6 August 2014 | | 361 × 401 (338 KB) | Maintenance script (Talk) | Uploaded by import script |
- You cannot overwrite this file.
File usage
The following page links to this file: