Search results
Create the page "The carbon cycle" on this wiki! See also the search results found.
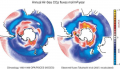
File:Figure 4.56 - Annual mean uptake of air-sea CO2 fluxes as calculated from OPA-PISCES 1990-1999.png ...colors), whereas south of 50°S, large regions act as a CO2 source for the atmosphere (red).(522 × 299 (218 KB)) - 15:30, 6 August 2014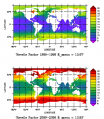
File:Figure 5.24 - Revelle factor in the IPSL coupled climate carbon model forced by the A2 scenario.png ...C. and Zeng, N. 2006. Climate-carbon cycle feedback analysis: Results from the C4MIP model intercomparison, ''Journal of Climate'', '''19''', 3337-3353.</(424 × 487 (123 KB)) - 15:31, 6 August 2014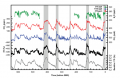
File:Figure 3.12 - Deuterium, atmospheric CO2, CH4 and N2O from air trapped in Antarctic ice cores.png ...PCC 2007. Climate Change 2007: The Physical Science Basis. Contribution of the Intergovernmental Panel on Climate Change. Cambridge University Press, Camb(609 × 395 (125 KB)) - 15:31, 6 August 2014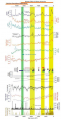
File:Figure 3.19a - Antarctic and Greenland holocene climate change compared using ice core data.png ...Annals of Glaciology'', '''39''', 127-132.</ref>, 2005). Green bar denotes the 8,800-8,200 year ago event seen in many globally distributed records associ(414 × 807 (400 KB)) - 15:31, 6 August 2014


