Search results
Create the page "The Southern Ocean" on this wiki! See also the search results found.
Page title matches
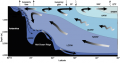
File:Figure 1.9 - Meridional section through the Southern Ocean overturning circulation.png ...cept along the coast where coastal currents move water westward (away from the observer).(551 × 291 (38 KB)) - 15:31, 6 August 2014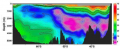
File:Figure 4.60 - Anthropogenic carbon concentrations in the Indian Ocean sector of the Southern Ocean.png ...05. Anthropogenic CO2 in the Southern Ocean: Distribution and inventory at the Indian-Atlantic boundary (WOCE line I6), ''Journal of Geophysical Research'(539 × 218 (192 KB)) - 15:31, 6 August 2014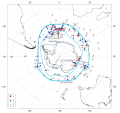
File:Figure 3.17 - Sea ice distribution at the Southern Ocean EPILOG-LGM time slice.png ...Sea-surface temperature and sea ice distribution of the Southern Ocean at the EPILOG Last Glacial Maximum-a circum-Antarctic view based on siliceous micr(552 × 520 (145 KB)) - 15:31, 6 August 2014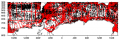
File:Figure 2.12 - Example figure produced using the Southern Ocean Atlas.png Example figure produced using the Southern Ocean Atlas (http://woceatlas.tamu.edu/). Dots show all data from 1900 to 2007 in(491 × 163 (110 KB)) - 15:31, 6 August 2014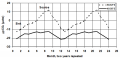
File:Figure 4.55 - The annual cycle atmosphere-ocean CO2 transport in the Southern Ocean.png ...and Schauer, B. 2006. Summer and Winter Air-Sea CO2 Fluxes in the Southern Ocean, Deep-Sea Research II, 53.</ref>).(570 × 281 (36 KB)) - 15:31, 6 August 2014


Page text matches
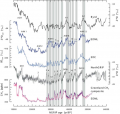
File:Figure 3.13 - Methane and d18O records covering the period 10-60 ka ago.png ...ch, K.A., Aoki, S., and Xiao, C. 2009. State of the Antarctic and Southern Ocean Climate System (SASOCS), ''Reviews of Geophysics'', '''47''', RG1003, doi:1(534 × 507 (185 KB)) - 15:30, 6 August 2014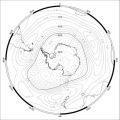
File:Figure 4.1 - Austral summer gridded 500hPa geopotential height monthly anomalies for 1989-2008.png ...tive anomalies over the Antarctic and positive anomalies over the Southern Ocean.(363 × 363 (106 KB)) - 15:30, 6 August 2014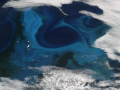
File:Figure 2.17 - Phytoplankton bloom off South Georgia.png Phytoplankton bloom off South Georgia in the Southern Ocean acquired by the Aqua MODIS instrument(353 × 265 (153 KB)) - 15:30, 6 August 2014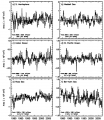
File:Figure 4.32 - Southern hemisphere regional sea ice extent monthly anomalies and trend lines.png ...the Southern Hemisphere; (b) Weddell Sea; (c) Indian Ocean; (d) W. Pacific Ocean; (e) Ross Sea; and (f) Bellingshausen/Amundsen Seas Sectors(516 × 595 (229 KB)) - 15:30, 6 August 2014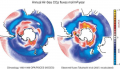
File:Figure 4.56 - Annual mean uptake of air-sea CO2 fluxes as calculated from OPA-PISCES 1990-1999.png ...colors), whereas south of 50°S, large regions act as a CO2 source for the atmosphere (red).(522 × 299 (218 KB)) - 15:30, 6 August 2014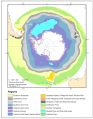
File:Figure 2.36 - Primary regionalisation of the Southern Ocean.png ...le, A., Raymond, B. and Doust, S. 2006. Bioregionalisation of the Southern Ocean, Report of Experts Workshop, Hobart, September 2006. WWF-Australia and ACE(365 × 468 (116 KB)) - 15:30, 6 August 2014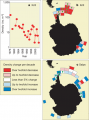
File:Figure 4.47 - Temporal change of krill and salps.png ...ong-term decline in krill stocks and increase in salps within the Southern Ocean, ''Nature'', '''432''' (7013), 100-103.</ref>), © 2004(466 × 626 (125 KB)) - 15:31, 6 August 2014File:Figure 1.9 - Meridional section through the Southern Ocean overturning circulation.png ...cept along the coast where coastal currents move water westward (away from the observer).(551 × 291 (38 KB)) - 15:31, 6 August 2014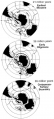
File:Figure 3.4 - Maps showing the progressive separation of Antarctica and the other continents.png ...The development of planktonic biostratigraphy in the Southern Ocean during the Cenozoic, ''Marine Micropaleontology'', '''3''', 301-345.</ref>).(279 × 615 (161 KB)) - 15:31, 6 August 2014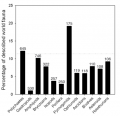
File:Figure 1.14 - Percentage of Antarctic macrobenthic invertebrate species of the described world fauna.png ...of the Gammaridean and Corophiidean Amphipoda (Crustacea) of the Southern Ocean with distribution and ecological data. Institut Royal des Sciences Naturell(402 × 387 (40 KB)) - 15:31, 6 August 2014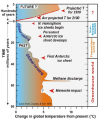
File:Figure 3.5 - Change in average global temperature over the last 80 million years.png ...ch, K.A., Aoki, S., and Xiao, C. 2009. State of the Antarctic and Southern Ocean Climate System (SASOCS), ''Reviews of Geophysics'', '''47''', RG1003, doi:1(435 × 524 (206 KB)) - 15:31, 6 August 2014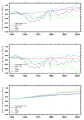
File:Figure 4.59 - Annual-averaged Southern Ocean uptake of total, natural and anthropogenic carbon.png ...b) natural carbon; c) anthropogenic carbon. The different experiments use the following colour coding, total experiment (black line), 1948 (red line), wi(461 × 658 (118 KB)) - 15:31, 6 August 2014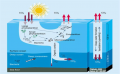
File:Figure 1.12 - Schematic of the biological and physical pump.png ...name="Chisholm, 2000">Chisholm, S.W. 2000. Stirring times in the Southern Ocean, ''Nature'', '''407''', 685-687.</ref>). Reprinted by permission from Macmi(541 × 335 (157 KB)) - 15:31, 6 August 2014File:Figure 4.60 - Anthropogenic carbon concentrations in the Indian Ocean sector of the Southern Ocean.png ...05. Anthropogenic CO2 in the Southern Ocean: Distribution and inventory at the Indian-Atlantic boundary (WOCE line I6), ''Journal of Geophysical Research'(539 × 218 (192 KB)) - 15:31, 6 August 2014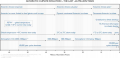
File:Figure 3.6 - Main climatic events of the last 65 million years in the Antarctic context.png ...ch, K.A., Aoki, S., and Xiao, C. 2009. State of the Antarctic and Southern Ocean Climate System (SASOCS), ''Reviews of Geophysics'', '''47''', RG1003, doi:1(601 × 290 (115 KB)) - 15:31, 6 August 2014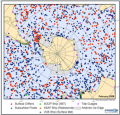
File:Figure 2.13a - JCOMMOPS Southern Ocean region observations as of February 2008.png Observations available in the Southern Ocean region from JCOMMOPS (as of February 2008).(265 × 254 (127 KB)) - 15:31, 6 August 2014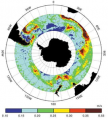
File:Figure 2.15 - Satellite altimetry showing high eddy kinetic energy in the core of the ACC.png ...1">Gille, S.T. and Sandwell, D.T. 2001. Gravity, Bathymetry, and Mesoscale Ocean Circulation from Altimetry, AVISO newsletter, 8, September.</ref>)(272 × 302 (112 KB)) - 15:31, 6 August 2014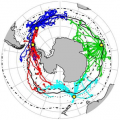
File:Figure 2.11 - Tracks of instrumented elephant seals.png ...p predator in relation to in situ oceanographic conditions, Proceedings of the National Academy of Sciences, 104, 34, 13705-13710.</ref>).(295 × 295 (129 KB)) - 15:31, 6 August 2014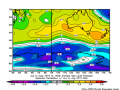
File:Figure 2.20 - Correlation pattern of JJA MSLP anomalies and MSA variability at GF12.png ...E) in Queen Mary Land. This shows the strong relationship between MSA and the SAM.(366 × 276 (91 KB)) - 15:31, 6 August 2014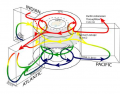
File:Figure 1.8 - Schematic of the global ocean circulation.png ...rn Ocean convection and bottom water formation and convective processes in the Northern Hemisphere.(514 × 404 (192 KB)) - 15:31, 6 August 2014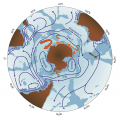
File:Figure 1.10 - Major currents south of 20S.png ...hue, 2007">McCartney, M.S. and Donohue, K.A. 2007. A deep cyclonic gyre in the Australian-Antarctic Basin, ''Progress in Oceanography'', '''75''', 675-750(601 × 589 (308 KB)) - 15:31, 6 August 2014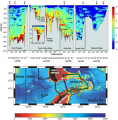
File:Figure 4.28 - Vertical distribution of turbulent diapycnal diffusivity along the rim of the Scotia Sea.png ...and Visbeck, M. 2004. Widespread intense turbulent mixing in the Southern Ocean, ''Science'', '''303''', 210-213.</ref>).(536 × 543 (332 KB)) - 15:31, 6 August 2014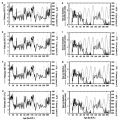
File:Figure 3.18 - February SSTs and sea ice duration in core SO136-111 and insolation curves.png ...2004. Late Qaternary sea ice history in the Indian sector of the Southern Ocean as record by diatom assemblages, ''Marine Micropaleontology'', '''50''', 20(553 × 559 (212 KB)) - 15:31, 6 August 2014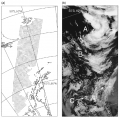
File:Figure 2.18 - Southern Ocean scatterometer and thermal infrared data acquired on 15 Jan 1995.png ...tterometer winds, Weather and Forecasting, 14, 867 877.</ref>; courtesy of the American Meteorological Society).(553 × 546 (376 KB)) - 15:31, 6 August 2014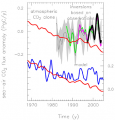
File:Figure 4.58 - Sea-air CO2 flux anomalies in the Southern Ocean.png ...., Metzl, N., Gillett, N. and Heimann, M. 2007. Saturation of the Southern Ocean CO2 Sink Due to Recent Climate Change, ''Science'', '''316''', 1735-1738, d(338 × 354 (63 KB)) - 15:31, 6 August 2014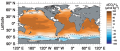
File:Figure 5.25 - Predicted aragonite saturation state of the surface ocean in the year 2100.png ...line represents the saturation horizon and shows that much of the Southern Ocean (<50ºS) is expected to be under-saturated with respect to aragonite(645 × 276 (136 KB)) - 15:31, 6 August 2014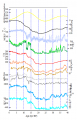
File:Figure 3.14 - Climate and environmental records of Termination I.png ...d Wolff, E. 2007. Orbital and millenial Antarctic climate variability over the past 800,000 years, ''Science'', '''317''', 793-796.</ref>).(418 × 649 (125 KB)) - 15:31, 6 August 2014File:Figure 3.17 - Sea ice distribution at the Southern Ocean EPILOG-LGM time slice.png ...Sea-surface temperature and sea ice distribution of the Southern Ocean at the EPILOG Last Glacial Maximum-a circum-Antarctic view based on siliceous micr(552 × 520 (145 KB)) - 15:31, 6 August 2014File:Figure 2.12 - Example figure produced using the Southern Ocean Atlas.png Example figure produced using the Southern Ocean Atlas (http://woceatlas.tamu.edu/). Dots show all data from 1900 to 2007 in(491 × 163 (110 KB)) - 15:31, 6 August 2014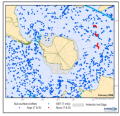
File:Figure 2.13b - JCOMMOPS Southern Ocean region sub-surface profiles as of February 2008.png Sub-surface profiles available in the Southern Ocean region from JCOMMOPS (as of February 2008).(265 × 256 (95 KB)) - 15:31, 6 August 2014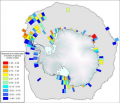
File:Figure 2.29 - Residual of regression of bivalve species richness against sampling effort, from SOMBASE.png ...ues below the mean; grey areas: no representative data. This example shows the high spatial heterogeneity obviously shaped by ecological conditions and be(324 × 278 (97 KB)) - 15:31, 6 August 2014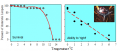
File:Figure 4.50 - Acute temperature influences on Antarctic invertebrates.png ...name="Peck, 2005">Peck, L.S. 2005. Prospects for survival in the Southern Ocean: vulnerability of benthic species to temperature change, ''Antarctic Sci.''(544 × 230 (28 KB)) - 15:31, 6 August 2014File:Figure 4.55 - The annual cycle atmosphere-ocean CO2 transport in the Southern Ocean.png ...and Schauer, B. 2006. Summer and Winter Air-Sea CO2 Fluxes in the Southern Ocean, Deep-Sea Research II, 53.</ref>).(570 × 281 (36 KB)) - 15:31, 6 August 2014


