Search results
Create the page "The Antarctic atmosphere" on this wiki! See also the search results found.
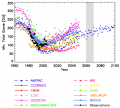
File:Figure 5.11 - Observations and model predictions of minimum September to October total column ozone.png ...r et al, 2005">Bodeker, G.E., Shiona, H. and Eskes, H. 2005. Indicators of Antarctic ozone depletion, ''Atmos. Chem. Phys.'', '''5''', 2603-2615.</ref>). Solid(543 × 488 (113 KB)) - 15:30, 6 August 2014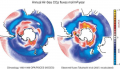
File:Figure 4.56 - Annual mean uptake of air-sea CO2 fluxes as calculated from OPA-PISCES 1990-1999.png ...ors), whereas south of 50°S, large regions act as a CO2 source for the atmosphere (red).(522 × 299 (218 KB)) - 15:30, 6 August 2014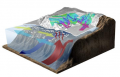
File:Figure 4.41 - Pictorial view of the ocean-ice system of the Ross Sea.png ...o the atmosphere (wavy vertical line) while the remainder circulated under the floating ice shelf causing basal melting. (illustration courtesy of Nationa(533 × 342 (194 KB)) - 15:31, 6 August 2014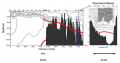
File:Figure 4.26 - Cross-section showing warm water penetrating the Pine Island Bay sub-ice shelf cavity.png ...tarc. Res. Ser.'', '''75''', 83-99.</ref>). The solid black area indicates the sea bed.(592 × 309 (119 KB)) - 15:31, 6 August 2014


