Search results
Create the page "Temperature" on this wiki! See also the search results found.
Page title matches
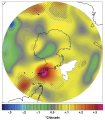
File:Figure 4.8b - Linear trends of annual mean surface air temperature for 1958-2002.png Linear trends of annual mean surface air temperature (°C /dec) for the period 1958–2002. Greens and blues denote cooli(554 × 631 (458 KB)) - 15:30, 6 August 2014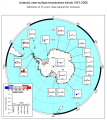
File:Figure 4.8a - Near-surface temperature trends for 1951-2006 based on station data.png Near-surface temperature trends for 1951-2006 based on station data.(549 × 614 (166 KB)) - 15:30, 6 August 2014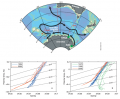
File:Figure 4.24 - Map of repeat section locations and deep potential temperature-salinity curves.png ...the Ross Sea and Adélie Land. Lower) Changes in the deep potential temperature – salinity curves along 115°E, over the continental rise (61-63.3(554 × 458 (131 KB)) - 15:30, 6 August 2014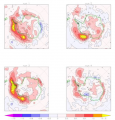
File:Figure 5.3 - Surface temperature trends for 1960-2000 for winter (JJA) for the MPI ECHAM5 model.png Surface temperature trends in oC/decade from 1960–2000 for winter (JJA) for the MPI ECHAM(512 × 535 (340 KB)) - 15:30, 6 August 2014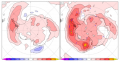
File:Figure 5.2 - Temperature trends for 1960-2000 for winter (JJA).png Temperature trends in oC/decade from 1960–2000 for winter (JJA). (a) Unweighted a(554 × 288 (145 KB)) - 15:30, 6 August 2014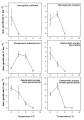
File:Figure 4.53 - Physiological temperature adaptation of Antarctic macroalgae.png Physiological temperature adaptation of Antarctic macroalgae (after Wiencke and Clayton, 2002<ref nam(466 × 666 (18 KB)) - 15:31, 6 August 2014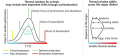
File:Figure 4.49 - Temperature effects on aquatic animals.png ...capacity, endurance, or protection. Positions and widths of windows on the temperature scale shift with life stage (right). Synergistic stressors like ocean acidi(527 × 248 (95 KB)) - 15:31, 6 August 2014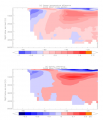
File:Figure 5.14 - Zonal mean difference between observed and simulated temperature and salinity, 1981-2000.png The zonal mean difference between observed (a) temperature (°C) and (b) salinity (psu) and the average of 19 CGCMS simulations for(514 × 597 (107 KB)) - 15:31, 6 August 2014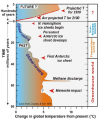
File:Figure 3.5 - Change in average global temperature over the last 80 million years.png ...mal Maximum, ''Science'', '''308''', 1611-1615.</ref>). The future rise in temperature expected from energy use projections shows the Earth warming back into the(435 × 524 (206 KB)) - 15:31, 6 August 2014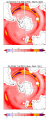
File:Figure 5.15(iii) - Ocean temperature change at 200m for summer and winter, between 2000 and 2100.png Ocean temperature change at 200 m for (a) summer and (b) winter, between 2000 and 2100.(252 × 611 (146 KB)) - 15:31, 6 August 2014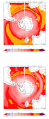
File:Figure 5.15(i) - Sea surface temperature change for summer and winter, between 2000 and 2100.png Sea surface temperature (SST) change for (a) summer and (b) winter between 2000 and 2100.(252 × 611 (154 KB)) - 15:31, 6 August 2014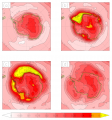
File:Figure 5.7 - Change in skin temperature by season over the Twenty First Century.png Skin temperature change over the Twenty First Century in ºC/decade. (a) DJF, (b) MAM, ((554 × 592 (364 KB)) - 15:31, 6 August 2014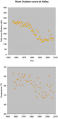
File:Figure 4.17 - Halley October mean total ozone and November mean 100hPa temperature by year.png ...der than in the 1960s and 1970s, with the exception of 2002. The change in temperature is a maximum in November, later than the maximum change in ozone, because t(330 × 678 (96 KB)) - 15:31, 6 August 2014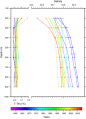
File:Figure 4.27 - Summer temperature and salinity profiles over a 50 year period near Ross Island.png ...~-1.91°C at a salinity of 34.8. Tfrs is the surface freezing reference temperature.(465 × 646 (90 KB)) - 15:31, 6 August 2014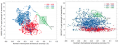
File:Figure 3.22 - Hemispheric phase diagrams for temperature versus ice core proxies for westerlies.png ...sch, K. 2006. Recent warming inconsistent with natural association between temperature and atmospheric circulation over the last 2000 years. Climate of the Past ((540 × 203 (107 KB)) - 15:31, 6 August 2014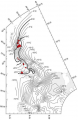
File:Figure 4.38 - Interpolated mean annual temperature and ice shelf loss due to climate-driven retreat.png ...is, E.M. and Vaughan, D.G. 2003. Spatial and temporal variation of surface temperature on the Antarctic Peninsula and the limit of viability of ice shelves, In An(360 × 552 (169 KB)) - 15:31, 6 August 2014
File:Figure 4.57 - Annual mean trends of temperature normalized fCO2 for regions of the SW Indian Ocean.png Annual mean trends of temperature normalized fCO2 in 4 regions of the South-Western Indian Ocean (based on su(523 × 244 (6 KB)) - 15:31, 6 August 2014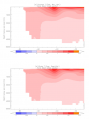
File:Figure 5.15(v) - Zonal mean cross section of ocean temperature difference between 2000 and 2100.png Zonal mean cross section of ocean temperature difference for (a) summer and (b) winter, between 2000 and 2100, superimpos(539 × 723 (93 KB)) - 15:31, 6 August 2014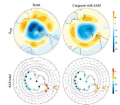
File:Figure 4.9 - Trends in December-May Z500, surface temperature and 925hPa winds, and SAM contribution.png ...r 500 hPa height and at increments of 0.5º K per 30 years for surface temperature. The longest vector corresponds to about 4 m/s. From Thompson and Solomon ((512 × 448 (269 KB)) - 15:31, 6 August 2014
File:Figure 4.10 - Annual and seasonal 500hPa temperature trends for 1971-2003.png Annual and seasonal 500 hPa (approximately at 5 km above mean sea level) temperature trends for 1971-2003. From Turner et al. (2006<ref name="Turner et al, 2006(553 × 553 (271 KB)) - 15:31, 6 August 2014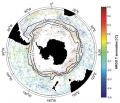
File:Figure 4.23 - ARGO temperature anomalies and ACC fronts.png ...e density loss by less salt is compensated by a density gain due to colder temperature. The major fronts representing ACC branches are displayed as dynamic height(554 × 477 (371 KB)) - 15:31, 6 August 2014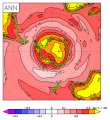
File:Figure 5.6 - Skin temperature trend over the Twenty First Century.png Skin temperature trend over Twenty First Century in ºC/decade.(388 × 425 (129 KB)) - 15:31, 6 August 2014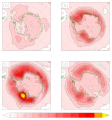
File:Figure 5.8 - Inter-model standard deviation of Twenty First Century skin temperature change by season.png Inter-model standard deviation of Twenty First Century skin temperature change for individual grid points in ºC/decade. (a) DJF, (b) MAM, (c)(554 × 592 (336 KB)) - 15:31, 6 August 2014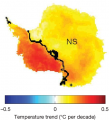
File:Figure 4.8c - Winter season temperature trends reconstructed using infrared satellite data.png Winter season temperature trends reconstructed using infrared satellite data. NS indicates the trends(455 × 500 (175 KB)) - 15:31, 6 August 2014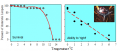
File:Figure 4.50 - Acute temperature influences on Antarctic invertebrates.png ...ts for survival in the Southern Ocean: vulnerability of benthic species to temperature change, ''Antarctic Sci.'', '''17''', 497-507.</ref>, unpublished).(544 × 230 (28 KB)) - 15:31, 6 August 2014


_for_the_MPI_ECHAM5_model.png)
.png)


_-_Zonal_mean_cross_section_of_ocean_temperature_difference_between_2000_and_2100.png)


Page text matches
File:Figure 4.8b - Linear trends of annual mean surface air temperature for 1958-2002.png Linear trends of annual mean surface air temperature (°C /dec) for the period 1958–2002. Greens and blues denote cooli(554 × 631 (458 KB)) - 15:30, 6 August 2014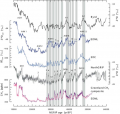
File:Figure 3.13 - Methane and d18O records covering the period 10-60 ka ago.png ...(CH4) synchronization of the ice core records of δ18O as a proxy for temperature reveals one-to-one association of Antarctic warming (AIM) events with corre(534 × 507 (185 KB)) - 15:30, 6 August 2014File:Figure 4.8a - Near-surface temperature trends for 1951-2006 based on station data.png Near-surface temperature trends for 1951-2006 based on station data.(549 × 614 (166 KB)) - 15:30, 6 August 2014File:Figure 4.24 - Map of repeat section locations and deep potential temperature-salinity curves.png ...the Ross Sea and Adélie Land. Lower) Changes in the deep potential temperature – salinity curves along 115°E, over the continental rise (61-63.3(554 × 458 (131 KB)) - 15:30, 6 August 2014File:Figure 5.3 - Surface temperature trends for 1960-2000 for winter (JJA) for the MPI ECHAM5 model.png Surface temperature trends in oC/decade from 1960–2000 for winter (JJA) for the MPI ECHAM(512 × 535 (340 KB)) - 15:30, 6 August 2014File:Figure 5.2 - Temperature trends for 1960-2000 for winter (JJA).png Temperature trends in oC/decade from 1960–2000 for winter (JJA). (a) Unweighted a(554 × 288 (145 KB)) - 15:30, 6 August 2014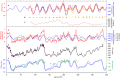
File:Figure 3.10 - Accurately dated Antarctic ice-core records and the comparison with sea level proxies.png ...Lambeck, K., Balbon, E. and Labracherie, M. 2002. Sea level and deep water temperature changes derived from bentic foraminifera isotopic records, ''Quat. Sci. Rev(611 × 396 (118 KB)) - 15:30, 6 August 2014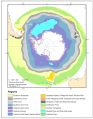
File:Figure 2.36 - Primary regionalisation of the Southern Ocean.png Primary regionalisation of the Southern Ocean based on depth, sea surface temperature, silicate, and nitrate concentrations (white areas represent cells with mis(365 × 468 (116 KB)) - 15:30, 6 August 2014File:Figure 4.53 - Physiological temperature adaptation of Antarctic macroalgae.png Physiological temperature adaptation of Antarctic macroalgae (after Wiencke and Clayton, 2002<ref nam(466 × 666 (18 KB)) - 15:31, 6 August 2014File:Figure 4.49 - Temperature effects on aquatic animals.png ...capacity, endurance, or protection. Positions and widths of windows on the temperature scale shift with life stage (right). Synergistic stressors like ocean acidi(527 × 248 (95 KB)) - 15:31, 6 August 2014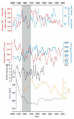
File:Figure 3.20 - Signals of climate change in ice core records from Siple Dome and Law Dome.png ...ture developed from calibration with instrumental mean annual and seasonal temperature values (van Ommen and Morgan, 1996<ref name="Ommen and Morgan, 1996">Van Om(436 × 702 (289 KB)) - 15:31, 6 August 2014File:Figure 5.14 - Zonal mean difference between observed and simulated temperature and salinity, 1981-2000.png The zonal mean difference between observed (a) temperature (°C) and (b) salinity (psu) and the average of 19 CGCMS simulations for(514 × 597 (107 KB)) - 15:31, 6 August 2014File:Figure 3.5 - Change in average global temperature over the last 80 million years.png ...mal Maximum, ''Science'', '''308''', 1611-1615.</ref>). The future rise in temperature expected from energy use projections shows the Earth warming back into the(435 × 524 (206 KB)) - 15:31, 6 August 2014File:Figure 5.15(iii) - Ocean temperature change at 200m for summer and winter, between 2000 and 2100.png Ocean temperature change at 200 m for (a) summer and (b) winter, between 2000 and 2100.(252 × 611 (146 KB)) - 15:31, 6 August 2014File:Figure 5.15(i) - Sea surface temperature change for summer and winter, between 2000 and 2100.png Sea surface temperature (SST) change for (a) summer and (b) winter between 2000 and 2100.(252 × 611 (154 KB)) - 15:31, 6 August 2014File:Figure 5.7 - Change in skin temperature by season over the Twenty First Century.png Skin temperature change over the Twenty First Century in ºC/decade. (a) DJF, (b) MAM, ((554 × 592 (364 KB)) - 15:31, 6 August 2014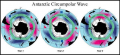
File:Figure 4.5 - Schematic summary of interannual variations in SST, sea level pressure and sea ice extent.png ...eterson, R. 1996. An Antarctic Circumpolar Wave in surface pressure, wind, temperature, and sea ice extent, ''Nature'', '''380''', 699-702.</ref>).(554 × 254 (220 KB)) - 15:31, 6 August 2014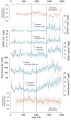
File:Figure 3.21 - Reconstructed temperatures and ice core reconstructed atmospheric circulation systems.png ...sch, K. 2006. Recent warming inconsistent with natural association between temperature and atmospheric circulation over the last 2000 years. Climate of the Past ((398 × 675 (293 KB)) - 15:31, 6 August 2014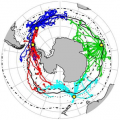
File:Figure 2.11 - Tracks of instrumented elephant seals.png Tracks of elephant seals tagged with instruments to record temperature and salinity profiles in the Southern Ocean (source Biuw et al., 2007<ref n(295 × 295 (129 KB)) - 15:31, 6 August 2014File:Figure 4.17 - Halley October mean total ozone and November mean 100hPa temperature by year.png ...der than in the 1960s and 1970s, with the exception of 2002. The change in temperature is a maximum in November, later than the maximum change in ozone, because t(330 × 678 (96 KB)) - 15:31, 6 August 2014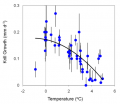
File:Figure 4.51 - Daily growth rates of krill in the Scotia Sea.png ...Antractic krill (Euphausia superba): II: Predictive models based on food, temperature, body length, sex, and maturity stage, ''Limnology and Oceanography'', '''5(419 × 363 (28 KB)) - 15:31, 6 August 2014File:Figure 4.27 - Summer temperature and salinity profiles over a 50 year period near Ross Island.png ...~-1.91°C at a salinity of 34.8. Tfrs is the surface freezing reference temperature.(465 × 646 (90 KB)) - 15:31, 6 August 2014
File:Figure 4.26 - Cross-section showing warm water penetrating the Pine Island Bay sub-ice shelf cavity.png ...d from the ship’s 3.5 kHz echosounder data. Right figure depicts the temperature field in front of Pine Island Glacier with its draft shaded in gray. This s(592 × 309 (119 KB)) - 15:31, 6 August 2014File:Figure 3.22 - Hemispheric phase diagrams for temperature versus ice core proxies for westerlies.png ...sch, K. 2006. Recent warming inconsistent with natural association between temperature and atmospheric circulation over the last 2000 years. Climate of the Past ((540 × 203 (107 KB)) - 15:31, 6 August 2014File:Figure 4.38 - Interpolated mean annual temperature and ice shelf loss due to climate-driven retreat.png ...is, E.M. and Vaughan, D.G. 2003. Spatial and temporal variation of surface temperature on the Antarctic Peninsula and the limit of viability of ice shelves, In An(360 × 552 (169 KB)) - 15:31, 6 August 2014File:Figure 4.57 - Annual mean trends of temperature normalized fCO2 for regions of the SW Indian Ocean.png Annual mean trends of temperature normalized fCO2 in 4 regions of the South-Western Indian Ocean (based on su(523 × 244 (6 KB)) - 15:31, 6 August 2014File:Figure 5.15(v) - Zonal mean cross section of ocean temperature difference between 2000 and 2100.png Zonal mean cross section of ocean temperature difference for (a) summer and (b) winter, between 2000 and 2100, superimpos(539 × 723 (93 KB)) - 15:31, 6 August 2014
File:Figure 3.12 - Deuterium, atmospheric CO2, CH4 and N2O from air trapped in Antarctic ice cores.png Variations in deuterium (δD; black), a proxy for local temperature, and the atmospheric concentrations of the greenhouse gases CO2 (red), CH4(609 × 395 (125 KB)) - 15:31, 6 August 2014File:Figure 4.9 - Trends in December-May Z500, surface temperature and 925hPa winds, and SAM contribution.png ...r 500 hPa height and at increments of 0.5º K per 30 years for surface temperature. The longest vector corresponds to about 4 m/s. From Thompson and Solomon ((512 × 448 (269 KB)) - 15:31, 6 August 2014File:Figure 4.10 - Annual and seasonal 500hPa temperature trends for 1971-2003.png Annual and seasonal 500 hPa (approximately at 5 km above mean sea level) temperature trends for 1971-2003. From Turner et al. (2006<ref name="Turner et al, 2006(553 × 553 (271 KB)) - 15:31, 6 August 2014
File:Figure 3.19a - Antarctic and Greenland holocene climate change compared using ice core data.png ...ical Research'', '''102''', 26455-26470.</ref>); Siple Dome ;18O proxy for temperature (Mayewski et al., 2004a<ref name="Mayewski et al, 2004a">Mayewski, P.A., Ro(414 × 807 (400 KB)) - 15:31, 6 August 2014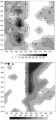
File:Figure 2.25 - Example of active layer spatial variability.png ...lmin, 2006<ref name="Guglielmin, 2006">Guglielmin, M. 2006. Ground surface temperature (GST), active layer, and permafrost monitoring in continental Antarctica. P(351 × 750 (221 KB)) - 19:23, 22 August 2014File:Figure 4.23 - ARGO temperature anomalies and ACC fronts.png ...e density loss by less salt is compensated by a density gain due to colder temperature. The major fronts representing ACC branches are displayed as dynamic height(554 × 477 (371 KB)) - 15:31, 6 August 2014File:Figure 5.6 - Skin temperature trend over the Twenty First Century.png Skin temperature trend over Twenty First Century in ºC/decade.(388 × 425 (129 KB)) - 15:31, 6 August 2014File:Figure 5.8 - Inter-model standard deviation of Twenty First Century skin temperature change by season.png Inter-model standard deviation of Twenty First Century skin temperature change for individual grid points in ºC/decade. (a) DJF, (b) MAM, (c)(554 × 592 (336 KB)) - 15:31, 6 August 2014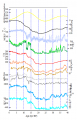
File:Figure 3.14 - Climate and environmental records of Termination I.png ...ref>); and finally, in light blue, EDC δD (‰), a proxy of EDC temperature (Jouzel et al., 2007<ref name="Jouzel et al, 2007">Jouzel, J., Masson-Delmo(418 × 649 (125 KB)) - 15:31, 6 August 2014File:Figure 4.8c - Winter season temperature trends reconstructed using infrared satellite data.png Winter season temperature trends reconstructed using infrared satellite data. NS indicates the trends(455 × 500 (175 KB)) - 15:31, 6 August 2014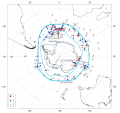
File:Figure 3.17 - Sea ice distribution at the Southern Ocean EPILOG-LGM time slice.png ...5">Gersonde, R., Crosta, X., Abelmann, A. and Armand, L. 2005. Sea-surface temperature and sea ice distribution of the Southern Ocean at the EPILOG Last Glacial M(552 × 520 (145 KB)) - 15:31, 6 August 2014File:Figure 4.50 - Acute temperature influences on Antarctic invertebrates.png ...ts for survival in the Southern Ocean: vulnerability of benthic species to temperature change, ''Antarctic Sci.'', '''17''', 497-507.</ref>, unpublished).(544 × 230 (28 KB)) - 15:31, 6 August 2014


_-_Ocean_temperature_change_at_200m_for_summer_and_winter,_between_2000_and_2100.png)
_-_Sea_surface_temperature_change_for_summer_and_winter,_between_2000_and_2100.png)