Search results
Create the page "Sea level" on this wiki! See also the search results found.
Page title matches
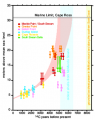
File:Figure 3.16 - Relative sea level curve for the Ross Sea based on radiocarbon dates.png ...2003">Hall, B.L., Baroni, C. and Denton, G.H. 2003. Holocene relative sea-level history of the southern Victoria Land coast, Antarctica, ''Global and Plane(386 × 488 (87 KB)) - 15:30, 6 August 2014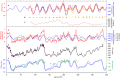
File:Figure 3.10 - Accurately dated Antarctic ice-core records and the comparison with sea level proxies.png ...J.C., McManus, J.F., Lambeck, K., Balbon, E. and Labracherie, M. 2002. Sea level and deep water temperature changes derived from bentic foraminifera isotopi(611 × 396 (118 KB)) - 15:30, 6 August 2014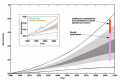
File:Figure 5.19 - Projected sea-level rise for the Twenty First Century.png ...e for the Twenty First Century. The projected range of global averaged sea-level rise from the IPCC 2001 Assessment Report for the period 1990 to 2100 is sh(532 × 353 (134 KB)) - 15:31, 6 August 2014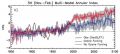
File:Figure 5.5 - Mean regression of the leading EOF of ensemble mean SH sea level pressure.png .... The grey shading represents the inter-model spread at the 95% confidence level and is filtered. A filtered version of the observed SLP from the Hadley Cen(542 × 244 (146 KB)) - 15:31, 6 August 2014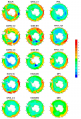
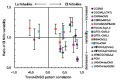
File:Figure 5.20 - Regional sea level rise projections in 2100 under SRESA1B relative to the global mean.png ..., Domingues, C.M., Hunter, J.R. and Lambeck, K. 2008. Understanding global sea levels: past, present and future, ''Sustainability Science'', '''3''', 9-22(459 × 675 (274 KB)) - 15:31, 6 August 2014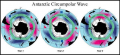
File:Figure 4.5 - Schematic summary of interannual variations in SST, sea level pressure and sea ice extent.png ...An Antarctic Circumpolar Wave in surface pressure, wind, temperature, and sea ice extent, ''Nature'', '''380''', 699-702.</ref>).(554 × 254 (220 KB)) - 15:31, 6 August 2014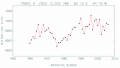
File:Figure 4.45 - PSMSL Argentine Islands Revised Local Reference (RLR) annual mean sea level time series.png PSMSL Revised Local Reference (RLR) annual mean sea level time series for Vernadsky/Faraday (called Argentine Islands in the PSMSL da(474 × 269 (17 KB)) - 15:31, 6 August 2014


_annual_mean_sea_level_time_series.png)
Page text matches
File:Figure 5.4 - Change in average tropical Pacific SSTs and El Nino variability simulated by AOGCMs.png ...is denoted by the ratio of the standard deviation of the first EOF of sea level pressure (SLP) between the current climate and the last 50 years of the IPC(468 × 316 (70 KB)) - 15:30, 6 August 2014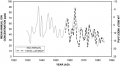
File:Figure 2.6 - Nitrate concentration at GD09 and JJA Macquarie Island-Scott Base MSLP gradient.png ...eastern Wilkes Land, East Antarctica) plotted against the average mean sea level pressure (MSLP) gradient between Macquarie Island and Scott Base for June,(497 × 274 (47 KB)) - 15:30, 6 August 2014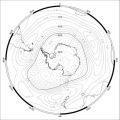
File:Figure 4.1 - Austral summer gridded 500hPa geopotential height monthly anomalies for 1989-2008.png ...he 500 hPa surface is approximately at an elevation of 5 km above mean sea level) for 1989-2008. Here the SAM is in its positive phase with negative anomali(363 × 363 (106 KB)) - 15:30, 6 August 2014File:Figure 3.16 - Relative sea level curve for the Ross Sea based on radiocarbon dates.png ...2003">Hall, B.L., Baroni, C. and Denton, G.H. 2003. Holocene relative sea-level history of the southern Victoria Land coast, Antarctica, ''Global and Plane(386 × 488 (87 KB)) - 15:30, 6 August 2014File:Figure 3.10 - Accurately dated Antarctic ice-core records and the comparison with sea level proxies.png ...J.C., McManus, J.F., Lambeck, K., Balbon, E. and Labracherie, M. 2002. Sea level and deep water temperature changes derived from bentic foraminifera isotopi(611 × 396 (118 KB)) - 15:30, 6 August 2014File:Figure 5.19 - Projected sea-level rise for the Twenty First Century.png ...e for the Twenty First Century. The projected range of global averaged sea-level rise from the IPCC 2001 Assessment Report for the period 1990 to 2100 is sh(532 × 353 (134 KB)) - 15:31, 6 August 2014File:Figure 5.5 - Mean regression of the leading EOF of ensemble mean SH sea level pressure.png .... The grey shading represents the inter-model spread at the 95% confidence level and is filtered. A filtered version of the observed SLP from the Hadley Cen(542 × 244 (146 KB)) - 15:31, 6 August 2014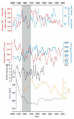
File:Figure 3.20 - Signals of climate change in ice core records from Siple Dome and Law Dome.png ...n Sea Low) and EAH (East Antarctic High), respectively, with estimated sea level pressure developed from calibration with the instrumental and NCEP reanalys(436 × 702 (289 KB)) - 15:31, 6 August 2014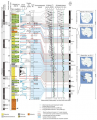
File:Figure 3.8 - Lithological column for the upper 600m of the AND-1B drillcore.png ...001071.</ref>) and the modelled contribution of Antarctic Ice Sheet to sea level change for the last 5 million years (Pollard and DeConto, 2009<ref name="Po(562 × 694 (486 KB)) - 15:31, 6 August 2014File:Figure 5.20 - Regional sea level rise projections in 2100 under SRESA1B relative to the global mean.png ..., Domingues, C.M., Hunter, J.R. and Lambeck, K. 2008. Understanding global sea levels: past, present and future, ''Sustainability Science'', '''3''', 9-22(459 × 675 (274 KB)) - 15:31, 6 August 2014File:Figure 4.5 - Schematic summary of interannual variations in SST, sea level pressure and sea ice extent.png ...An Antarctic Circumpolar Wave in surface pressure, wind, temperature, and sea ice extent, ''Nature'', '''380''', 699-702.</ref>).(554 × 254 (220 KB)) - 15:31, 6 August 2014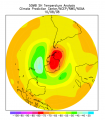
File:Figure 1.13 - The Antarctic polar vortex in mid-winter.png ...s C on the 50 hPa pressure surface (roughly 20 km elevation above mean sea level). Generated from the NCEP reanalysis using their online, interactive chart(551 × 628 (189 KB)) - 15:31, 6 August 2014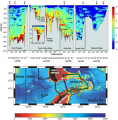
File:Figure 4.28 - Vertical distribution of turbulent diapycnal diffusivity along the rim of the Scotia Sea.png ...asured (top), is displayed along a section following the rim of the Scotia Sea anticlockwise (green dots on the bottom graph). Density surfaces separating(536 × 543 (332 KB)) - 15:31, 6 August 2014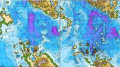
File:Figure 2.33 - Bed elevations of the Amundsen Sea Embayment.png ...below sea level, with deeper blue signifying greater depths. The Amundsen Sea is in the lower left corner. Comparison shows that the recent surveys provi(447 × 250 (342 KB)) - 15:31, 6 August 2014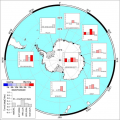
File:Figure 4.10 - Annual and seasonal 500hPa temperature trends for 1971-2003.png Annual and seasonal 500 hPa (approximately at 5 km above mean sea level) temperature trends for 1971-2003. From Turner et al. (2006<ref name="Turne(553 × 553 (271 KB)) - 15:31, 6 August 2014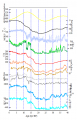
File:Figure 3.14 - Climate and environmental records of Termination I.png ...bach, D., Barbante, C., Gabrielli, P. and Gaspari, V. 2006. Southern Ocean sea-ice extent, productivity and iron flux over the past eight glacial cycles,(418 × 649 (125 KB)) - 15:31, 6 August 2014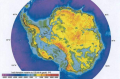
File:Figure 1.4 - Antarctic bed elevation.png Bed elevation illustrating major regions (in blue and green) below sea level, the major subglacial continent underneath East Antarctica, and the mountai(628 × 413 (414 KB)) - 15:31, 6 August 2014File:Figure 4.45 - PSMSL Argentine Islands Revised Local Reference (RLR) annual mean sea level time series.png PSMSL Revised Local Reference (RLR) annual mean sea level time series for Vernadsky/Faraday (called Argentine Islands in the PSMSL da(474 × 269 (17 KB)) - 15:31, 6 August 2014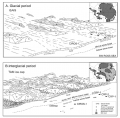
File:Figure 3.7 - View of the Victoria Land coast off Cape Roberts during Oligocene and early Miocene times.png ...name="DeConto et al, 2007">Deconto, R., Pollard, D. and Harwood, D. 2007. Sea ice feedback and Cenozoic evolution of Antarctic climate and ice sheets, Pa(479 × 471 (169 KB)) - 15:31, 6 August 2014


