Search results
Create the page "Ozone" on this wiki! See also the search results found.
Page title matches
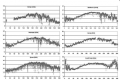
File:Figure 4.18 - Surface ozone by day for Halley, MacMurdo, Neumayer, Sanae, Syowa and South Pole.png ...A.E., Labuschagne, C., Anlauf, K. and Hayden, K. 2007. A review of surface ozone in the polar regions, ''Atmos. Env.'', '''41''', 5138-5161, doi:10.1016/j.a(538 × 358 (131 KB)) - 15:30, 6 August 2014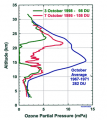
File:Figure 4.14 - South pole ozone profiles.png ...showing the progressive thinning of the ozone layer in late spring as the ozone hole developed during the 1980s and 1990s (courtesy NOAA/CMDL).(340 × 381 (73 KB)) - 15:30, 6 August 2014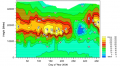
File:Figure 4.15 - The annual cycle of ozone in 2006 at Neumayer.png The annual cycle of ozone (nbar) in 2006 at Neumayer, 71°S (courtesy Alfred Wegener Institute).(551 × 303 (130 KB)) - 15:31, 6 August 2014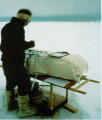
File:Figure 2.3 - The Dobson ozone spectrophotometer at Halley.png ...during an intercomparison of instruments prior to the announcement of the ozone hole in 1985 (courtesy British Antarctic Survey).(320 × 376 (239 KB)) - 15:31, 6 August 2014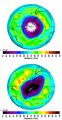
File:Figure 4.16 - Aura satellite Ozone Monitoring Instrument measurements on 14 Sep 2006 and 10 Oct 2006.png ...covering all of Antarctica. Bottom – on 10 October 2006, showing the ozone hole extending towards South America. (courtesy NASA/GSFC).(356 × 688 (176 KB)) - 15:31, 6 August 2014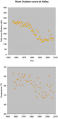
File:Figure 4.17 - Halley October mean total ozone and November mean 100hPa temperature by year.png ...cators of any large reduction in the chlorine and bromine gases that cause ozone loss.(330 × 678 (96 KB)) - 15:31, 6 August 2014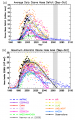
File:Figure 5.12 - Observations and predictions of average ozone mass deficit and maximum ozone hole area.png ...essment of Ozone Depletion: 2006, World Meteorological Organisation Global Ozone Research and Monitoring Project – Report No. 50, Geneva, Switzerland(520 × 829 (237 KB)) - 15:31, 6 August 2014


Page text matches
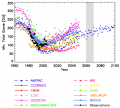
File:Figure 5.11 - Observations and model predictions of minimum September to October total column ozone.png ...essment of Ozone Depletion: 2006, World Meteorological Organisation Global Ozone Research and Monitoring Project – Report No. 50, Geneva, Switzerland(543 × 488 (113 KB)) - 15:30, 6 August 2014File:Figure 4.18 - Surface ozone by day for Halley, MacMurdo, Neumayer, Sanae, Syowa and South Pole.png ...A.E., Labuschagne, C., Anlauf, K. and Hayden, K. 2007. A review of surface ozone in the polar regions, ''Atmos. Env.'', '''41''', 5138-5161, doi:10.1016/j.a(538 × 358 (131 KB)) - 15:30, 6 August 2014File:Figure 4.14 - South pole ozone profiles.png ...showing the progressive thinning of the ozone layer in late spring as the ozone hole developed during the 1980s and 1990s (courtesy NOAA/CMDL).(340 × 381 (73 KB)) - 15:30, 6 August 2014
File:Figure 5.5 - Mean regression of the leading EOF of ensemble mean SH sea level pressure.png ...filtered version of the mean with ozone forcing; the blue line is without ozone forcing. The grey shading represents the inter-model spread at the 95% conf(542 × 244 (146 KB)) - 15:31, 6 August 2014File:Figure 4.15 - The annual cycle of ozone in 2006 at Neumayer.png The annual cycle of ozone (nbar) in 2006 at Neumayer, 71°S (courtesy Alfred Wegener Institute).(551 × 303 (130 KB)) - 15:31, 6 August 2014File:Figure 2.3 - The Dobson ozone spectrophotometer at Halley.png ...during an intercomparison of instruments prior to the announcement of the ozone hole in 1985 (courtesy British Antarctic Survey).(320 × 376 (239 KB)) - 15:31, 6 August 2014File:Figure 4.16 - Aura satellite Ozone Monitoring Instrument measurements on 14 Sep 2006 and 10 Oct 2006.png ...covering all of Antarctica. Bottom – on 10 October 2006, showing the ozone hole extending towards South America. (courtesy NASA/GSFC).(356 × 688 (176 KB)) - 15:31, 6 August 2014File:Figure 4.17 - Halley October mean total ozone and November mean 100hPa temperature by year.png ...cators of any large reduction in the chlorine and bromine gases that cause ozone loss.(330 × 678 (96 KB)) - 15:31, 6 August 2014File:Figure 5.12 - Observations and predictions of average ozone mass deficit and maximum ozone hole area.png ...essment of Ozone Depletion: 2006, World Meteorological Organisation Global Ozone Research and Monitoring Project – Report No. 50, Geneva, Switzerland(520 × 829 (237 KB)) - 15:31, 6 August 2014

