Search results
Create the page "The Antarctic ice sheet" on this wiki! See also the search results found.
Page title matches
File:Figure 2.24 - Composite of the Antarctic ice sheet surface speed.png ...Antarctic Mapping Project. BPRC Report No. 22, Byrd Polar Research Center, The Ohio State University, Columbus, Ohio, 64 p.</ref>.(539 × 458 (279 KB)) - 15:31, 6 August 2014

Page text matches
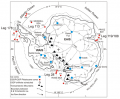
File:Figure 3.1 - Map of Antarctica showing locations of selected deep ice and sediment cores.png ...at Seymour Island (SI), James Ross Island (JRI), Alexander Island (AI) and the Beardmore Glacier region (BG).(512 × 422 (151 KB)) - 15:30, 6 August 2014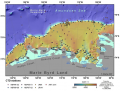
File:Figure 4.25 - Amundsen Sea bathymetric chart and hydrographic stations of different cruises.png ...ers refer to the Nathaniel B. Palmer (NBP), the James Clark Ross (JCR) and the Polarstern (ANT).(637 × 481 (343 KB)) - 15:30, 6 August 2014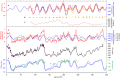
File:Figure 3.10 - Accurately dated Antarctic ice-core records and the comparison with sea level proxies.png ...ans, J. 2005. Modelled atmospheric temperatures and global sea levels over the past million years, ''Nature'', '''437''', 125-128.</ref>) and regression a(611 × 396 (118 KB)) - 15:30, 6 August 2014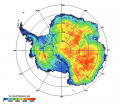
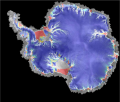
File:Figure 1.5 - Antarctic ice thickness.png ...nent ice shelves that represent floating extensions of the continental ice sheet. From Lythe, Vaughan and BEDMAP Consortium, 2001.(624 × 542 (347 KB)) - 15:31, 6 August 2014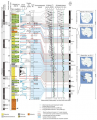
File:Figure 3.8 - Lithological column for the upper 600m of the AND-1B drillcore.png ...lch, T. and Williams, T. 2009. Obliquity-paced Pliocene West Antarctic ice sheet oscillations, ''Nature'', '''458''', 322-328.</ref>).(562 × 694 (486 KB)) - 15:31, 6 August 2014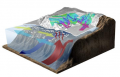
File:Figure 4.41 - Pictorial view of the ocean-ice system of the Ross Sea.png ...ere (wavy vertical line) while the remainder circulated under the floating ice shelf causing basal melting. (illustration courtesy of National Geographic)(533 × 342 (194 KB)) - 15:31, 6 August 2014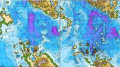
File:Figure 2.33 - Bed elevations of the Amundsen Sea Embayment.png ...n shows that the recent surveys provided a more detailed representation of the subglacial topography.(447 × 250 (342 KB)) - 15:31, 6 August 2014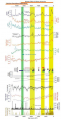
File:Figure 3.19a - Antarctic and Greenland holocene climate change compared using ice core data.png ...Annals of Glaciology'', '''39''', 127-132.</ref>, 2005). Green bar denotes the 8,800-8,200 year ago event seen in many globally distributed records associ(414 × 807 (400 KB)) - 15:31, 6 August 2014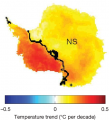
File:Figure 4.8c - Winter season temperature trends reconstructed using infrared satellite data.png ...and Shindell, D.T. 2009. Warming of the Antarctic ice-sheet surface since the 1957 International Geophysical Year, ''Nature'', '''457''', 459-462.</ref>)(455 × 500 (175 KB)) - 15:31, 6 August 2014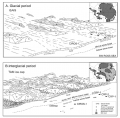
File:Figure 3.7 - View of the Victoria Land coast off Cape Roberts during Oligocene and early Miocene times.png ...e filled circle. TAM = Transantarctic Mountains, EAIS = East Antarctic Ice Sheet.(479 × 471 (169 KB)) - 15:31, 6 August 2014


