Search results
Create the page "Models" on this wiki! See also the search results found.
Page title matches
File:Figure 5.1 - Projected global annual CO2 emissions, 1990-2100, used to run models for the IPCC AR4.png (524 × 315 (105 KB)) - 15:31, 6 August 2014

Page text matches
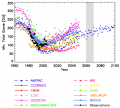
File:Figure 5.11 - Observations and model predictions of minimum September to October total column ozone.png Minimum total column ozone in September to October predicted by various models, plus observations from the National Institute of Water and Atmosphere Rese(543 × 488 (113 KB)) - 15:30, 6 August 2014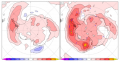
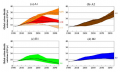
File:Figure 5.2 - Temperature trends for 1960-2000 for winter (JJA).png ...M. and Bracegirdle, T.J. 2007. An Antarctic assessment of IPCC AR4 coupled models, ''Geophys. Res. Lett.'', '''34''', L22505, doi:10.1029/2007GL031648.</ref>(554 × 288 (145 KB)) - 15:30, 6 August 2014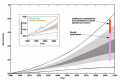
File:Figure 5.19 - Projected sea-level rise for the Twenty First Century.png ...or all greenhouse gas scenarios, the light shading is the envelope for all models and all scenarios and the outer lines include an allowance for an additiona(532 × 353 (134 KB)) - 15:31, 6 August 2014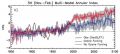
File:Figure 5.5 - Mean regression of the leading EOF of ensemble mean SH sea level pressure.png ...century Intergovernmental Panel on Climate Change Fourth Assessment Report models, J. Geophys. Res., 111, doi:10.1029/2005JD006323.</ref>). From IPCC (2007<r(542 × 244 (146 KB)) - 15:31, 6 August 2014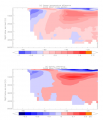
File:Figure 5.14 - Zonal mean difference between observed and simulated temperature and salinity, 1981-2000.png ...ean Atlas (2001, http://www.nodc.noaa.gov/OC5/WOA01/pr_woa01.html). The 19 models for which sufficient data for the 20C3M runs was available are CCCMA CGCM3.(514 × 597 (107 KB)) - 15:31, 6 August 2014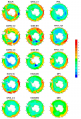
File:Figure 5.20 - Regional sea level rise projections in 2100 under SRESA1B relative to the global mean.png Regional Sea level rise projections for 15 IPCC AR4 models for the SRESA1B scenario at 2100 relative to the global mean, following the(459 × 675 (274 KB)) - 15:31, 6 August 2014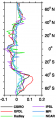
File:Figure 5.23 - Primary productivity changes for 2040-2060 in six coupled climate carbon models.png ...alkowski, P.G. 1997. A consumers guide to phytoplankton primary production models, ''Limnol. Oceanogr.'', '''47''', 1479-1491.</ref>), and changes were asses(278 × 590 (57 KB)) - 15:31, 6 August 2014
File:Figure 2.31 - Simulated 20th century Weddell Gyre strength in 16 AR4 climate models.png ...ted decadal means of Weddell Gyre strengths by 16 IPCC AR4 coupled climate models during the 20th century (IPCC, 2007<ref name="IPCC, 2007">IPCC 2007. Climat(553 × 790 (106 KB)) - 15:31, 6 August 2014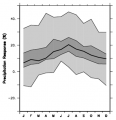
File:Figure 5.9 - 21st century change in the annual cycle of Antarctic precipitation under the A1B scenario.png ...mong the 21 models, while the light grey area shows the total range of the models.(437 × 453 (50 KB)) - 15:31, 6 August 2014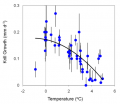
File:Figure 4.51 - Daily growth rates of krill in the Scotia Sea.png ...atural growth rates of Antractic krill (Euphausia superba): II: Predictive models based on food, temperature, body length, sex, and maturity stage, ''Limnolo(419 × 363 (28 KB)) - 15:31, 6 August 2014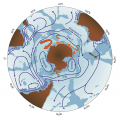
File:Figure 1.10 - Major currents south of 20S.png ...2008. Density-driven Southern Hemisphere subpolar gyres in coupled climate models, Geophysical Research Letters, 35(14) 5, pp. 10.1029/2008GL034344.</ref>),(601 × 589 (308 KB)) - 15:31, 6 August 2014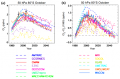
File:Figure 5.13 - Zonal mean total inorganic chlorine in October at 50hPa and 80S predicted by models.png ...chlorine (ppbv) in October at 50 hPa (20-25 km) and 80°S predicted by models: (a) total, (b) difference from 1980. Open black diamonds in (a) show estim(487 × 319 (86 KB)) - 15:31, 6 August 2014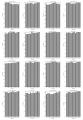
File:Figure 2.32 - Simulated 20th century Antarctic precipitation in 16 AR4 climate models.png ...ation averaged over the Antarctic continent by 16 IPCC AR4 coupled climate models during the 20th century.(553 × 802 (98 KB)) - 15:31, 6 August 2014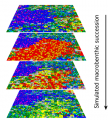
File:Figure 2.37 - Simulation of a benthic succession.png ...uency due to enhanced deglaciation in Antarctica. Thus, spatially explicit models can be a useful tool predicting biodiversity changes under these different(369 × 411 (227 KB)) - 15:31, 6 August 2014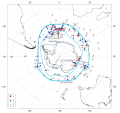
File:Figure 3.17 - Sea ice distribution at the Southern Ocean EPILOG-LGM time slice.png ...in percent derived with Modern Analog Techniques and Generalized Additive Models. Signature legend: (1) concomitant occurrence of cold-water indicator diato(552 × 520 (145 KB)) - 15:31, 6 August 2014

.png)


