File list
Jump to:
navigation
,
search
This special page shows all uploaded files.
File list
Items per page:
20
50
100
250
500
Search for media name:
Username:
Include old versions of images
Date
Name
Thumbnail
Size
User
Description
Versions
15:31, 6 August 2014
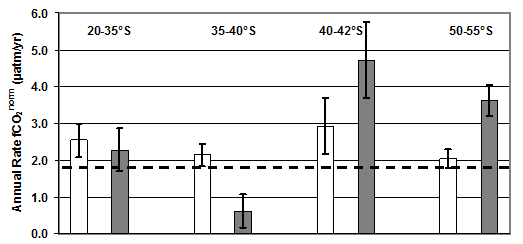
Figure 4.57 - Annual mean trends of temperature normalized fCO2 for regions of the SW Indian Ocean.png
(
file
)
6 KB
Maintenance script
Uploaded by import script
1
15:31, 6 August 2014
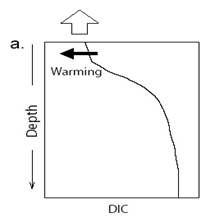
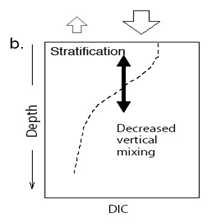
Figure 5.22a - Expected impact of increased stratification on ocean dissolved inorganic carbon.png
(
file
)
9 KB
Maintenance script
Uploaded by import script
1
15:30, 6 August 2014
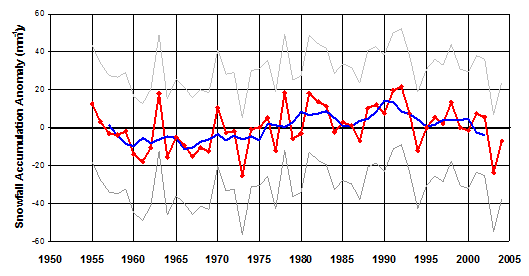
Figure 4.12 - Annual Antarctic snowfall accumulation anomalies.png
(
file
)
11 KB
Maintenance script
Uploaded by import script
1
15:31, 6 August 2014
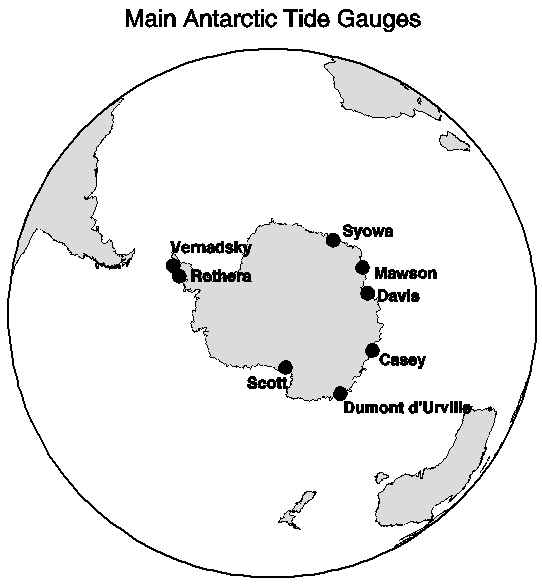
Figure 2.28 - Map of the main Antarctic tide gauges.png
(
file
)
12 KB
Maintenance script
Uploaded by import script
1
15:30, 6 August 2014
Figure 5.22b - Expected impact of sea surface warming on ocean dissolved inorganic carbon.png
(
file
)
14 KB
Maintenance script
Uploaded by import script
1
15:31, 6 August 2014
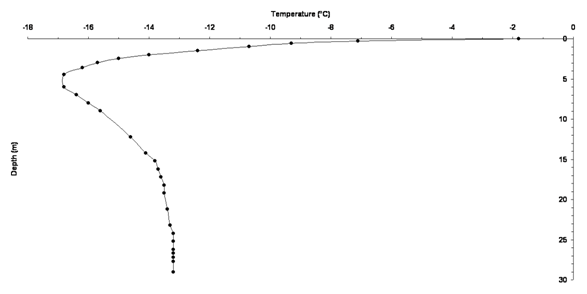
Figure 4.44 - Permafrost profile recorded in the borehole at Oasi on 7 November 2006.png
(
file
)
15 KB
Maintenance script
Uploaded by import script
1
15:31, 6 August 2014
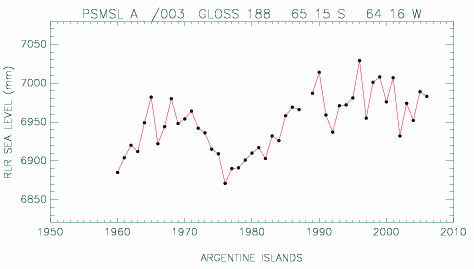
Figure 4.45 - PSMSL Argentine Islands Revised Local Reference (RLR) annual mean sea level time series.png
(
file
)
17 KB
Maintenance script
Uploaded by import script
1
15:31, 6 August 2014
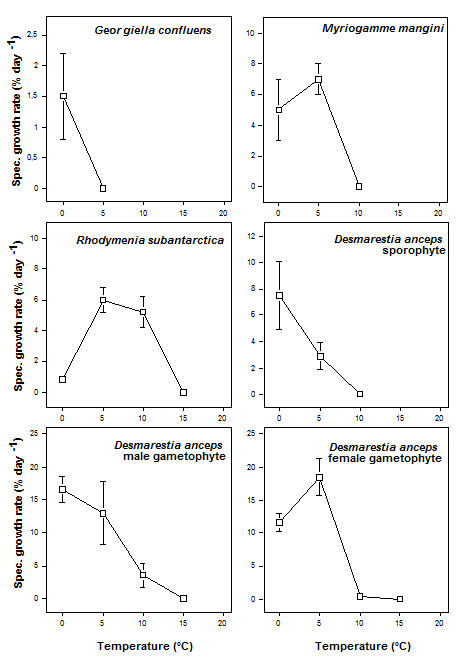
Figure 4.53 - Physiological temperature adaptation of Antarctic macroalgae.png
(
file
)
18 KB
Maintenance script
Uploaded by import script
1
15:31, 6 August 2014
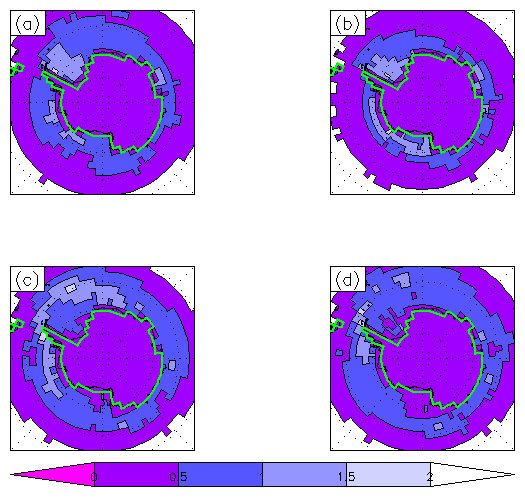
Figure 5.17 - Signal to noise ratio of projections of sea ice reduction.png
(
file
)
20 KB
Maintenance script
Uploaded by import script
1
15:31, 6 August 2014
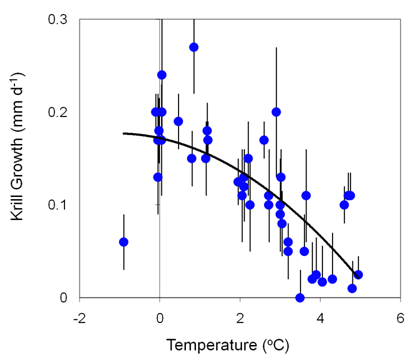
Figure 4.51 - Daily growth rates of krill in the Scotia Sea.png
(
file
)
28 KB
Maintenance script
Uploaded by import script
1
15:31, 6 August 2014
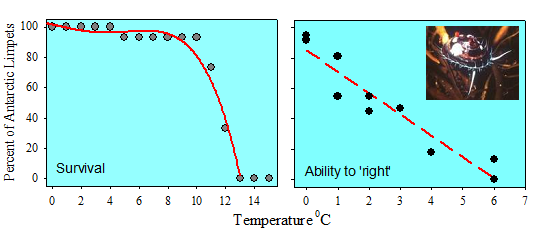
Figure 4.50 - Acute temperature influences on Antarctic invertebrates.png
(
file
)
28 KB
Maintenance script
Uploaded by import script
1
15:30, 6 August 2014
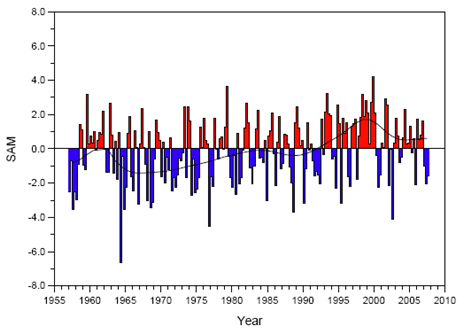
Figure 4.2 - Seasonal values of the SAM index calculated from station data.png
(
file
)
35 KB
Maintenance script
Uploaded by import script
1
15:31, 6 August 2014
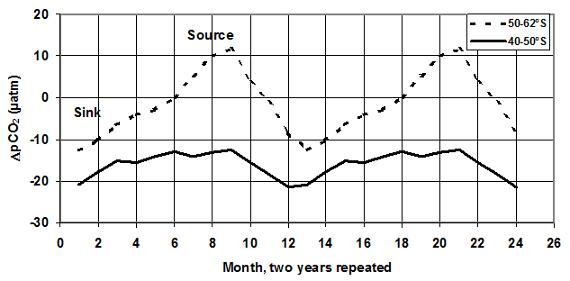
Figure 4.55 - The annual cycle atmosphere-ocean CO2 transport in the Southern Ocean.png
(
file
)
36 KB
Maintenance script
Uploaded by import script
1
15:31, 6 August 2014
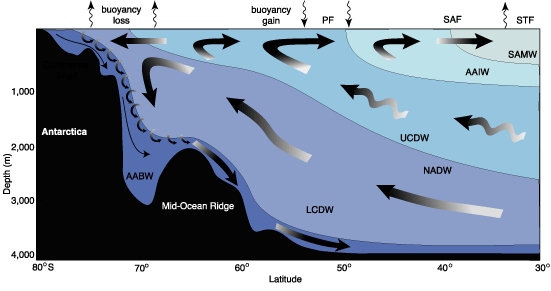
Figure 1.9 - Meridional section through the Southern Ocean overturning circulation.png
(
file
)
38 KB
Maintenance script
Uploaded by import script
1
15:31, 6 August 2014
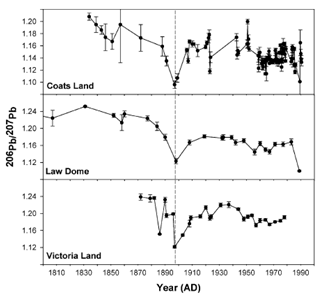
Figure 4.54 - 206Pb to 207Pb ratios at Coats Land, Law Dome and Victoria Land over the past 200 years.png
(
file
)
39 KB
Maintenance script
Uploaded by import script
1
15:31, 6 August 2014
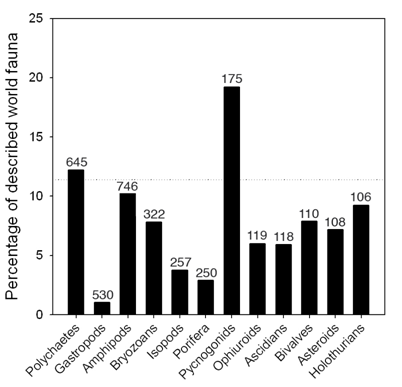
Figure 1.14 - Percentage of Antarctic macrobenthic invertebrate species of the described world fauna.png
(
file
)
40 KB
Maintenance script
Uploaded by import script
1
15:30, 6 August 2014
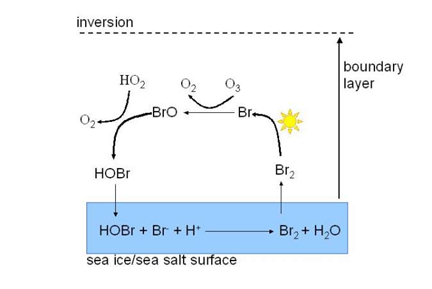
Figure 4.19 - A schematic representation of the Bromine Explosion.png
(
file
)
42 KB
Maintenance script
Uploaded by import script
1
15:30, 6 August 2014
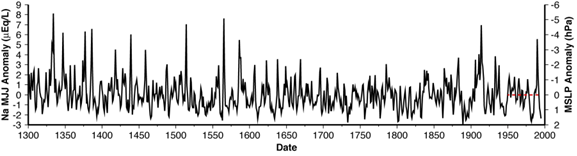
Figure 2.8 - Sodium May-July anomalies, 1300-1995.png
(
file
)
46 KB
Maintenance script
Uploaded by import script
1
15:31, 6 August 2014
Figure 3.24 - Diatom and highly-branched isoprenoid records from an Adelie Trough sediment core.png
(
file
)
47 KB
Maintenance script
Uploaded by import script
1
15:30, 6 August 2014
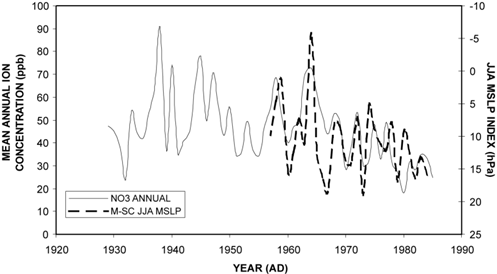
Figure 2.6 - Nitrate concentration at GD09 and JJA Macquarie Island-Scott Base MSLP gradient.png
(
file
)
47 KB
Maintenance script
Uploaded by import script
1
15:31, 6 August 2014
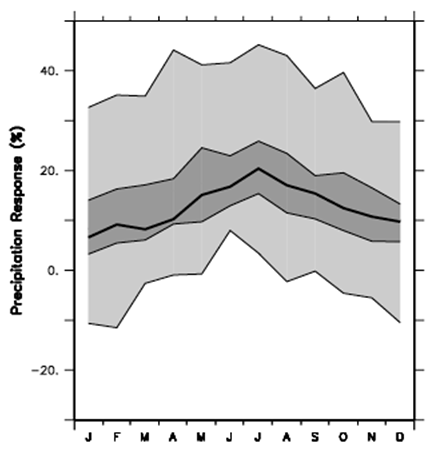
Figure 5.9 - 21st century change in the annual cycle of Antarctic precipitation under the A1B scenario.png
(
file
)
50 KB
Maintenance script
Uploaded by import script
1
15:31, 6 August 2014
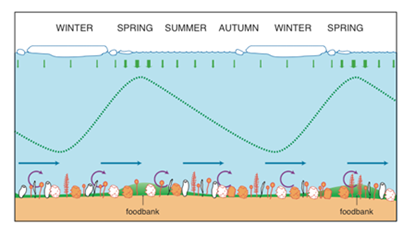
Figure 4.52 - Seasonal cycles of Antarctic shelf seabed organic matter transport processes.png
(
file
)
50 KB
Maintenance script
Uploaded by import script
1
15:31, 6 August 2014
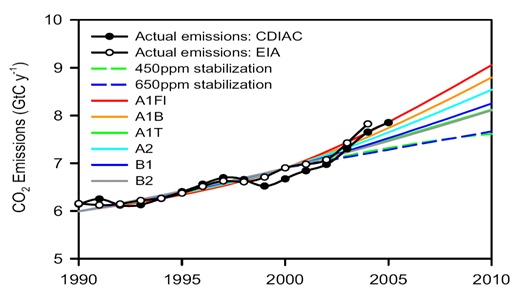
Figure 5.21 - Observed CO2 emissions over the last 25 years compared with IPCC emission scenarios.png
(
file
)
51 KB
Maintenance script
Uploaded by import script
1
15:31, 6 August 2014
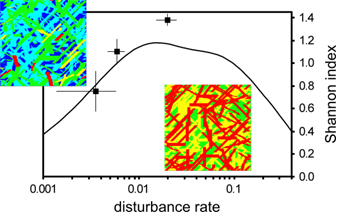
Figure 5.31 - Benthic diversity on the Antarctic shelf predicted for a range of disturbance rates.png
(
file
)
53 KB
Maintenance script
Uploaded by import script
1
15:30, 6 August 2014
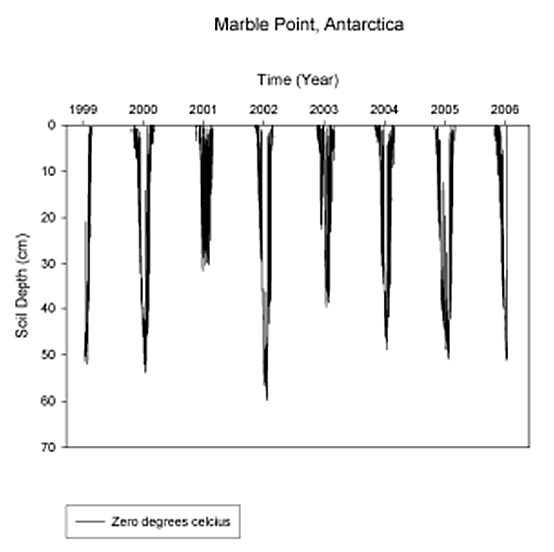
Figure 2.27 - Variation in active layer thickness at Marble Point, 1999-2006.png
(
file
)
54 KB
Maintenance script
Uploaded by import script
1
15:31, 6 August 2014
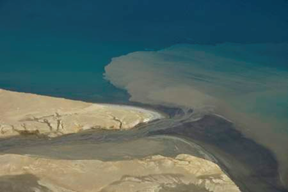
Figure 5.28 - Suspension washed into the ocean east of the Antarctic Peninsula.png
(
file
)
57 KB
Maintenance script
Uploaded by import script
1
15:31, 6 August 2014
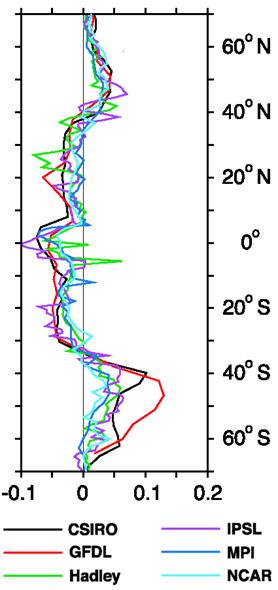
Figure 5.23 - Primary productivity changes for 2040-2060 in six coupled climate carbon models.png
(
file
)
57 KB
Maintenance script
Uploaded by import script
1
15:31, 6 August 2014
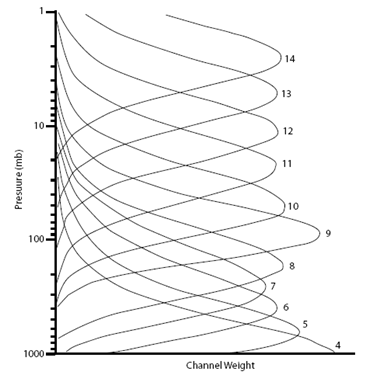
Figure 2.5 - The weighting functions for channels 4-14 of the AMSU-A instrument.png
(
file
)
60 KB
Maintenance script
Uploaded by import script
1
15:31, 6 August 2014
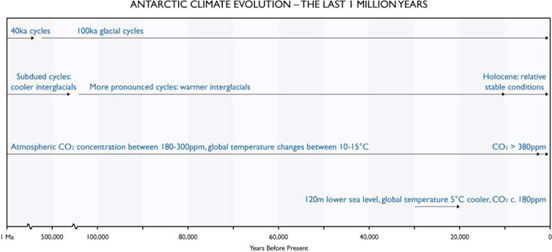
Figure 3.9 - Main climatic events of the last 1 Million years in the Antarctic context.png
(
file
)
61 KB
Maintenance script
Uploaded by import script
1
15:31, 6 August 2014
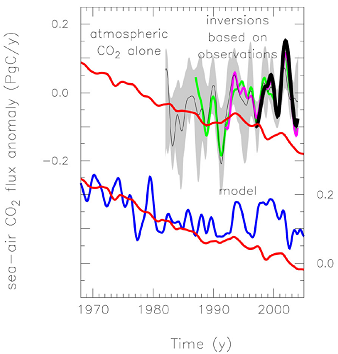
Figure 4.58 - Sea-air CO2 flux anomalies in the Southern Ocean.png
(
file
)
63 KB
Maintenance script
Uploaded by import script
1
15:31, 6 August 2014
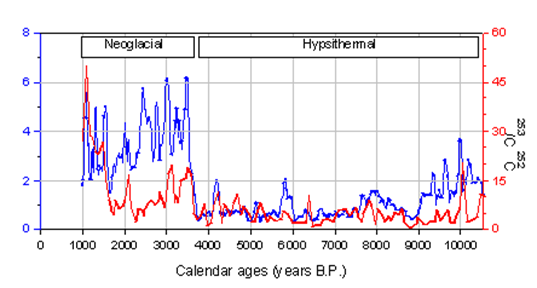
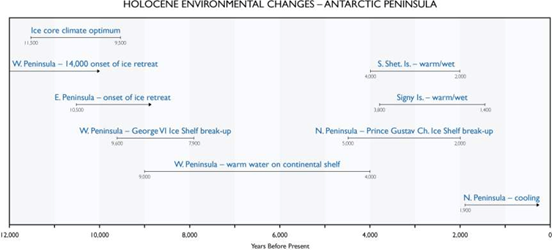
Figure 3.26 - Selected Holocene environmental changes - Antarctic Peninsula.png
(
file
)
68 KB
Maintenance script
Uploaded by import script
1
15:31, 6 August 2014
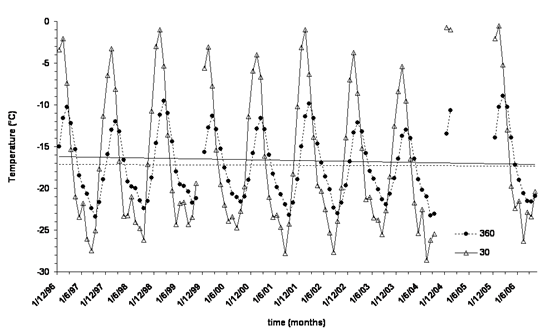
Figure 4.43 - Monthly mean temperatures at depths of 30cm and 360cm at Boulder Clay since 1996.png
(
file
)
68 KB
Maintenance script
Uploaded by import script
1
15:31, 6 August 2014
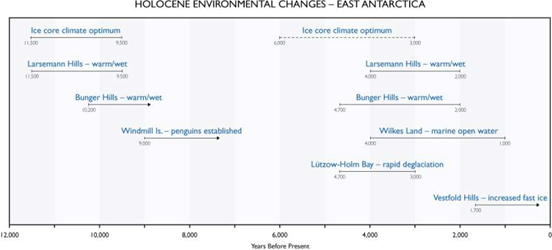
Figure 3.25 - Selected Holocene environmental changes - East Antarctica.png
(
file
)
68 KB
Maintenance script
Uploaded by import script
1
15:30, 6 August 2014
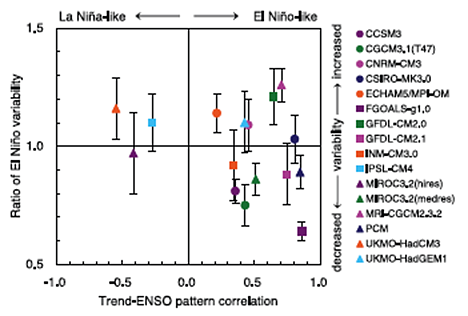
Figure 5.4 - Change in average tropical Pacific SSTs and El Nino variability simulated by AOGCMs.png
(
file
)
70 KB
Maintenance script
Uploaded by import script
1
15:31, 6 August 2014
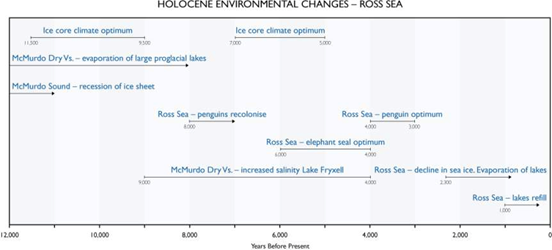
Figure 3.28 - Selected Holocene environmental changes - Ross Sea.png
(
file
)
71 KB
Maintenance script
Uploaded by import script
1
15:31, 6 August 2014
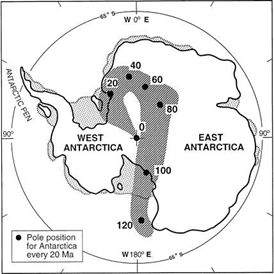
Figure 3.2 - Apparent polar wander path for East Antarctica over the last 120 million years.png
(
file
)
72 KB
Maintenance script
Uploaded by import script
1
15:30, 6 August 2014
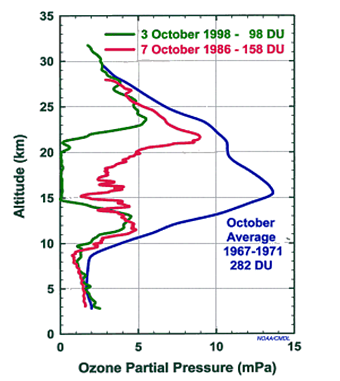
Figure 4.14 - South pole ozone profiles.png
(
file
)
73 KB
Maintenance script
Uploaded by import script
1
15:30, 6 August 2014
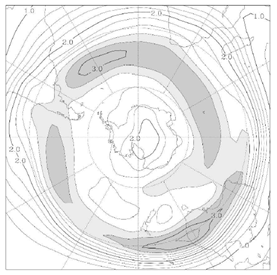
Figure 4.7b - Vorticity variance for winter 1958-2002.png
(
file
)
78 KB
Maintenance script
Uploaded by import script
1
15:31, 6 August 2014
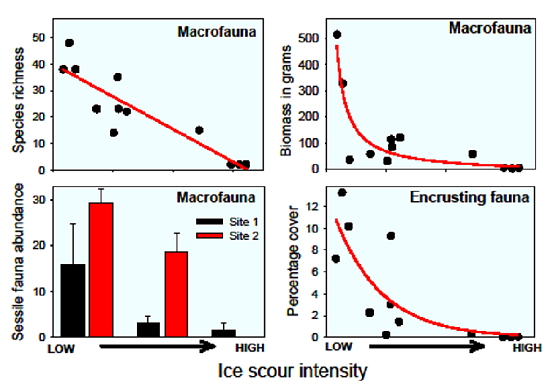
Figure 5.26 - The influence of ice scour on fauna in the shallows at Adelaide Island.png
(
file
)
80 KB
Maintenance script
Uploaded by import script
1
15:31, 6 August 2014
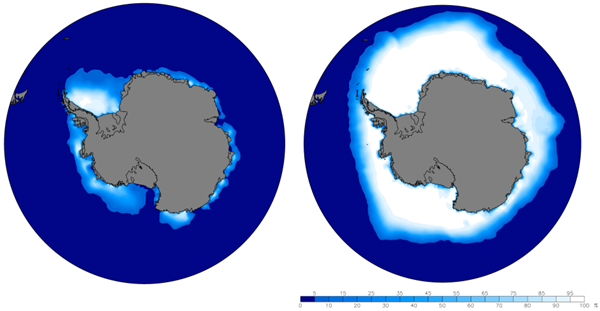
Figure 1.7 - Antarctic summer and winter sea ice extent.png
(
file
)
84 KB
Maintenance script
Uploaded by import script
1
15:30, 6 August 2014
Figure 2.16 - Schematic of a single ICESat repeat track.png
(
file
)
84 KB
Maintenance script
Uploaded by import script
1
15:31, 6 August 2014
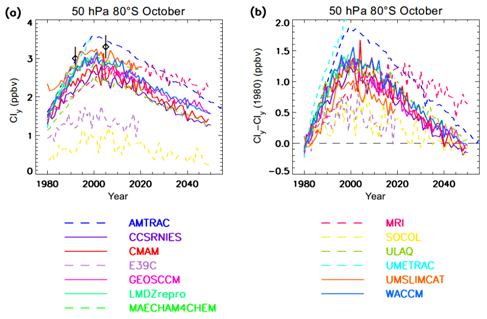
Figure 5.13 - Zonal mean total inorganic chlorine in October at 50hPa and 80S predicted by models.png
(
file
)
86 KB
Maintenance script
Uploaded by import script
1
15:30, 6 August 2014
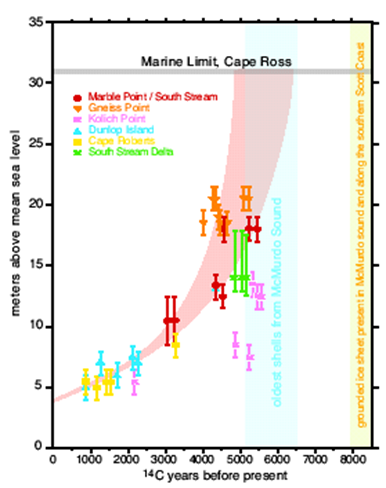
Figure 3.16 - Relative sea level curve for the Ross Sea based on radiocarbon dates.png
(
file
)
87 KB
Maintenance script
Uploaded by import script
1
15:30, 6 August 2014
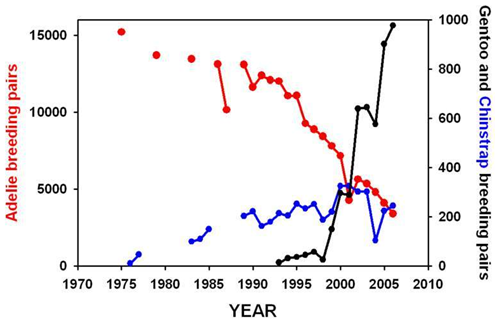
Figure 4.48 - Population trends for three penguin species in the vicinity of Anvers Island.png
(
file
)
88 KB
Maintenance script
Uploaded by import script
1
15:31, 6 August 2014
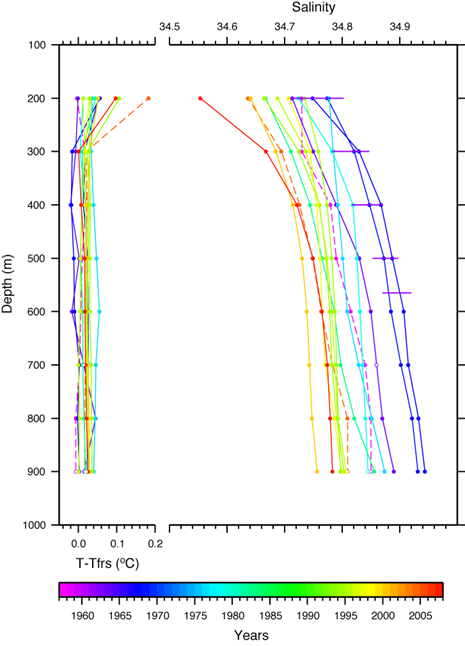
Figure 4.27 - Summer temperature and salinity profiles over a 50 year period near Ross Island.png
(
file
)
90 KB
Maintenance script
Uploaded by import script
1
15:31, 6 August 2014
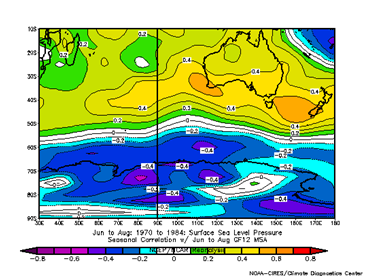
Figure 2.20 - Correlation pattern of JJA MSLP anomalies and MSA variability at GF12.png
(
file
)
91 KB
Maintenance script
Uploaded by import script
1
15:31, 6 August 2014
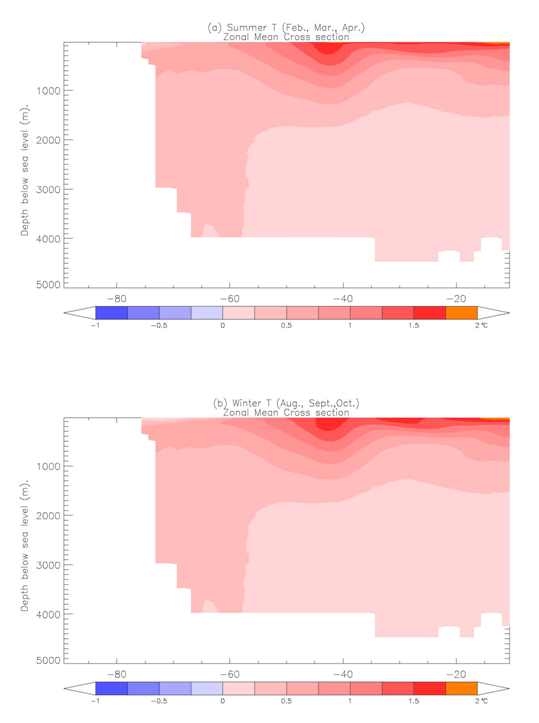
Figure 5.15(v) - Zonal mean cross section of ocean temperature difference between 2000 and 2100.png
(
file
)
93 KB
Maintenance script
Uploaded by import script
1
15:31, 6 August 2014
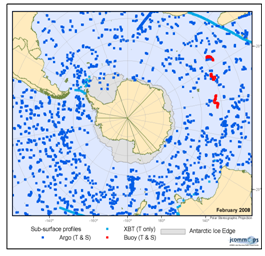
Figure 2.13b - JCOMMOPS Southern Ocean region sub-surface profiles as of February 2008.png
(
file
)
95 KB
Maintenance script
Uploaded by import script
1
15:31, 6 August 2014
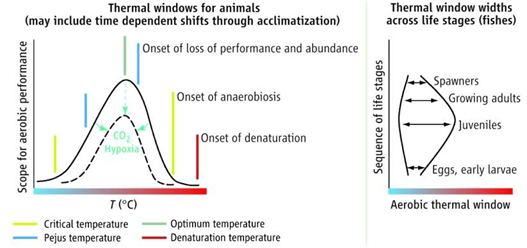
Figure 4.49 - Temperature effects on aquatic animals.png
(
file
)
95 KB
Maintenance script
Uploaded by import script
1
15:31, 6 August 2014
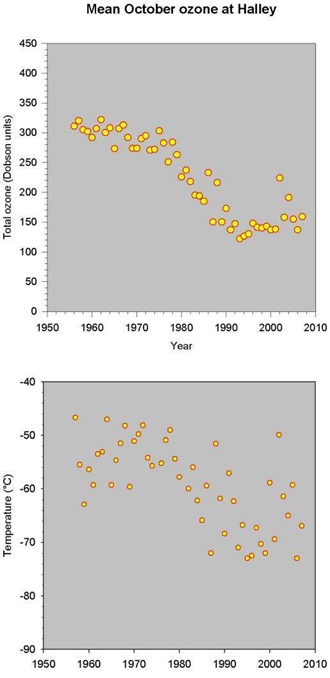
Figure 4.17 - Halley October mean total ozone and November mean 100hPa temperature by year.png
(
file
)
96 KB
Maintenance script
Uploaded by import script
1
First page
Previous page
Next page
Last page
Navigation menu
Personal tools
Log in
Namespaces
Special page
Variants
Views
Actions
Search
Navigation
Home
Contents
About ACCE
Key points
The Antarctic environment in the global system
Observations, data accuracy and tools
The pre-instrumental period
The instrumental period
The next 100 years
Recommendations
Help
Help
Tools
Special pages
Printable version


_annual_mean_sea_level_time_series.png)


_-_Zonal_mean_cross_section_of_ocean_temperature_difference_between_2000_and_2100.png)


