File list
This special page shows all uploaded files.
| Date | Thumbnail | Size | User | Description | Versions | |
|---|---|---|---|---|---|---|
| 17:48, 21 August 2014 | ACCE banner.jpg (file) |  |
146 KB | Tonyp | Banner image for ACCE home page | 1 |
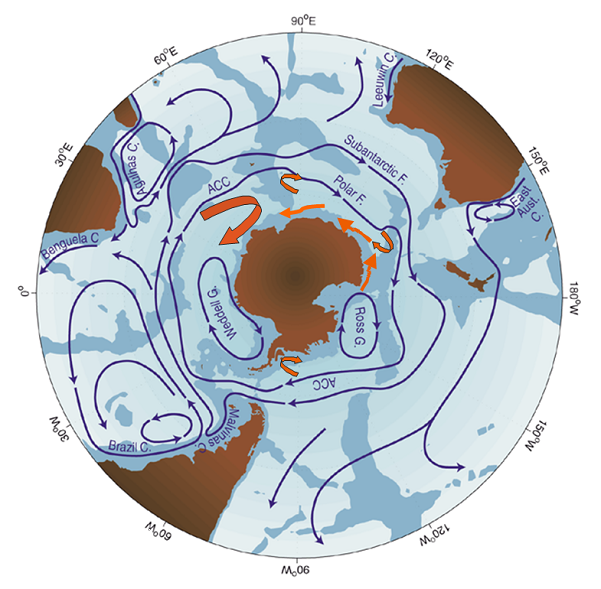
| 15:31, 6 August 2014 | Figure 1.10 - Major currents south of 20S.png (file) |  |
308 KB | Maintenance script | Uploaded by import script | 1 |
| 15:31, 6 August 2014 | Figure 1.11 - Column inventories of anthropogenic CO2 in the ocean.png (file) |  |
199 KB | Maintenance script | Uploaded by import script | 1 |
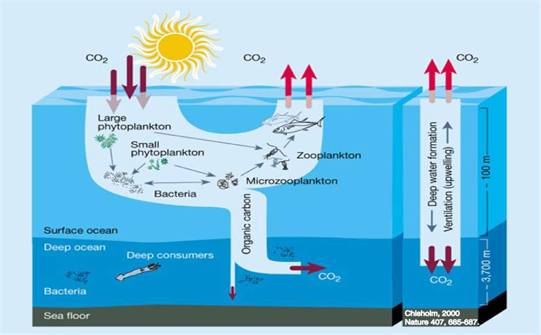
| 15:31, 6 August 2014 | Figure 1.12 - Schematic of the biological and physical pump.png (file) |  |
157 KB | Maintenance script | Uploaded by import script | 1 |
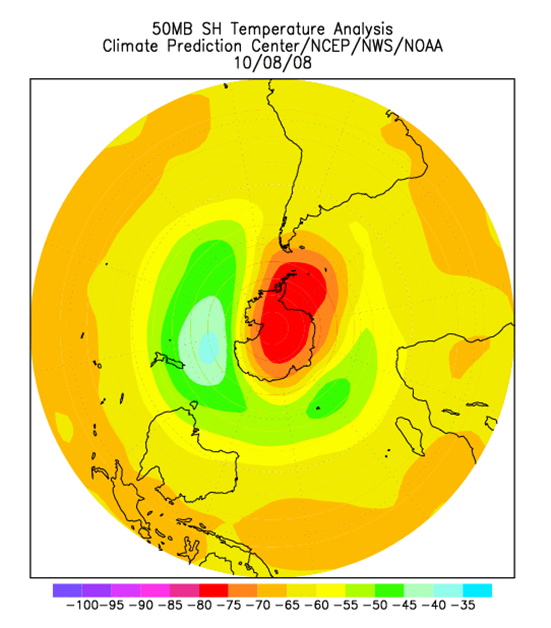
| 15:31, 6 August 2014 | Figure 1.13 - The Antarctic polar vortex in mid-winter.png (file) |  |
189 KB | Maintenance script | Uploaded by import script | 1 |
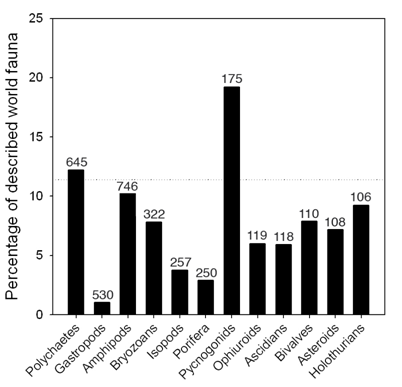
| 15:31, 6 August 2014 | Figure 1.14 - Percentage of Antarctic macrobenthic invertebrate species of the described world fauna.png (file) |  |
40 KB | Maintenance script | Uploaded by import script | 1 |
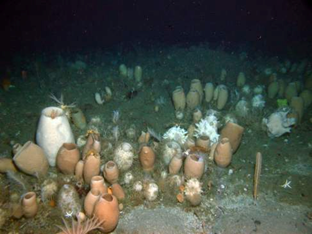
| 15:31, 6 August 2014 | Figure 1.15 - A rich megabenthic community on the shelf of the southeastern Weddell Sea.png (file) |  |
125 KB | Maintenance script | Uploaded by import script | 1 |
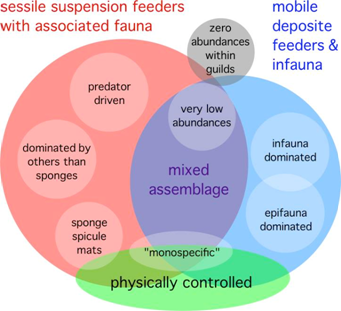
| 15:30, 6 August 2014 | Figure 1.16 - Classification of macro-benthic communities on the continental Antarctic shelf.png (file) |  |
117 KB | Maintenance script | Uploaded by import script | 1 |
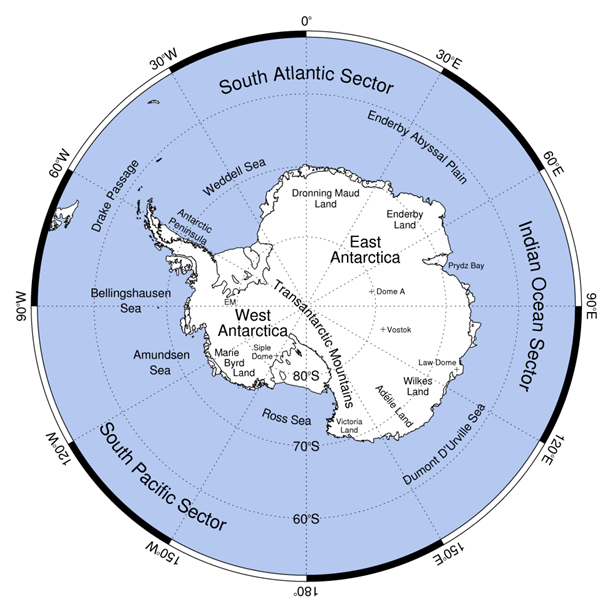
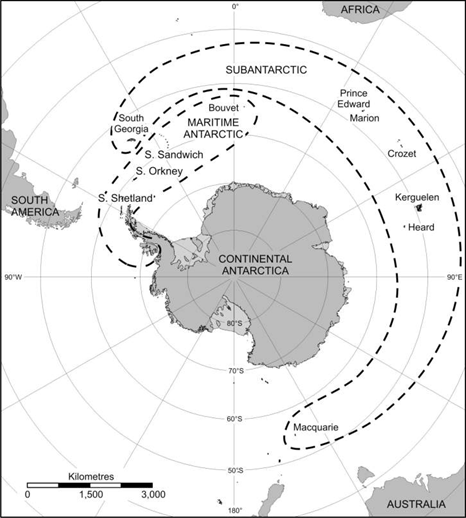
| 15:31, 6 August 2014 | Figure 1.1a - Map of Antarctica.png (file) |  |
207 KB | Maintenance script | Uploaded by import script | 1 |
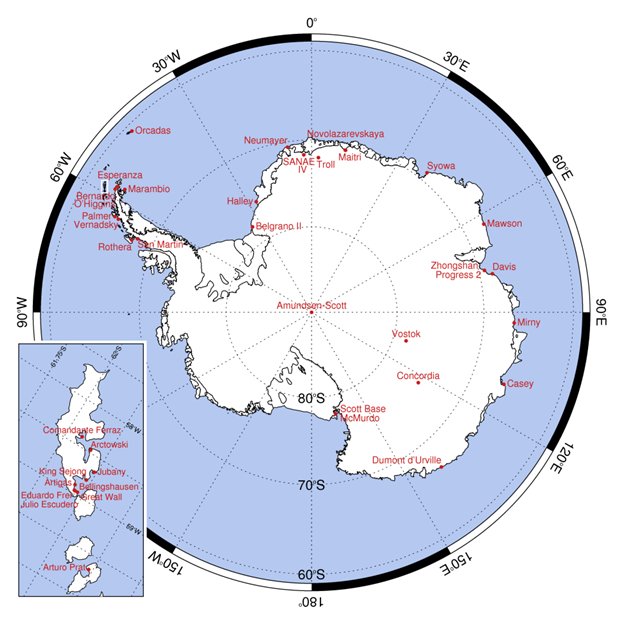
| 15:31, 6 August 2014 | Figure 1.1b - Map of Antarctic stations.png (file) |  |
210 KB | Maintenance script | Uploaded by import script | 1 |
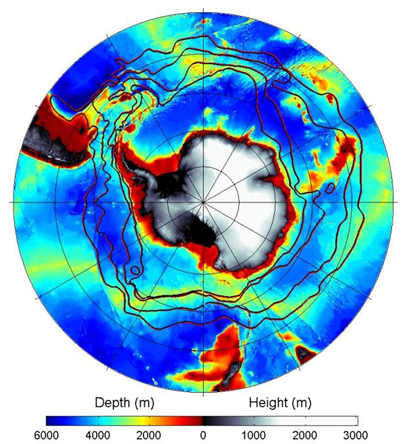
| 15:31, 6 August 2014 | Figure 1.2 - Antarctic topography and bathymetry.png (file) |  |
307 KB | Maintenance script | Uploaded by import script | 1 |
| 15:31, 6 August 2014 | Figure 1.3 - Antarctic surface elevation.png (file) |  |
416 KB | Maintenance script | Uploaded by import script | 1 |
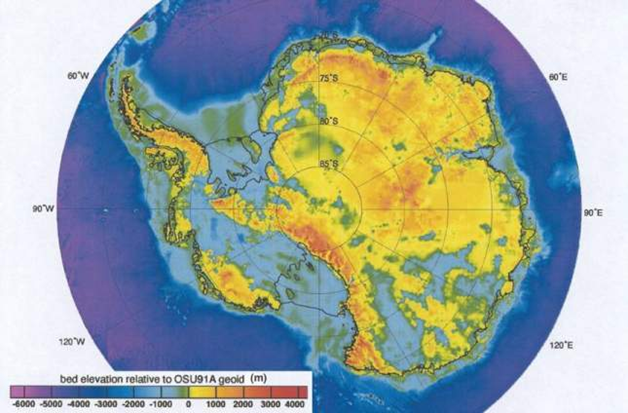
| 15:31, 6 August 2014 | Figure 1.4 - Antarctic bed elevation.png (file) |  |
414 KB | Maintenance script | Uploaded by import script | 1 |
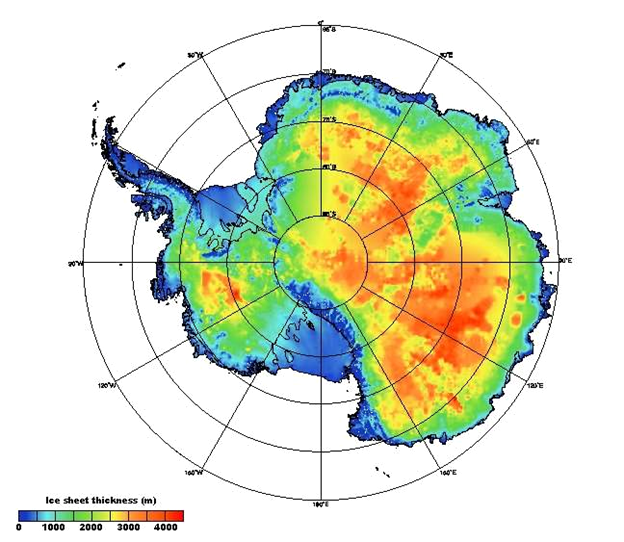
| 15:31, 6 August 2014 | Figure 1.5 - Antarctic ice thickness.png (file) |  |
347 KB | Maintenance script | Uploaded by import script | 1 |
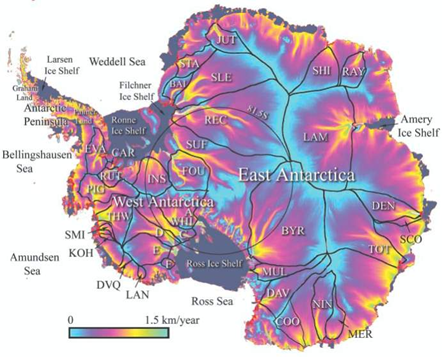
| 15:30, 6 August 2014 | Figure 1.6 - Antarctic ice sheet balance velocity.png (file) |  |
259 KB | Maintenance script | Uploaded by import script | 1 |
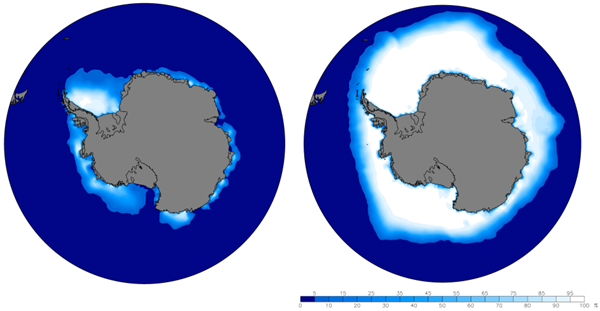
| 15:31, 6 August 2014 | Figure 1.7 - Antarctic summer and winter sea ice extent.png (file) |  |
84 KB | Maintenance script | Uploaded by import script | 1 |
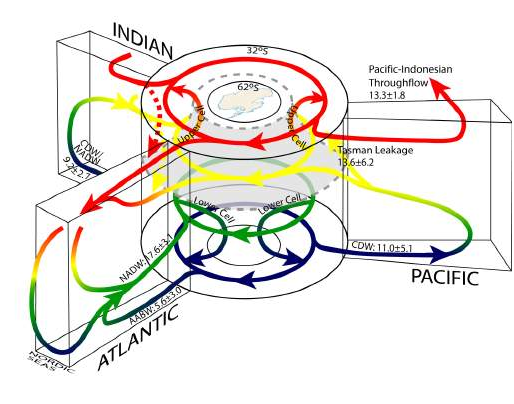
| 15:31, 6 August 2014 | Figure 1.8 - Schematic of the global ocean circulation.png (file) |  |
192 KB | Maintenance script | Uploaded by import script | 1 |
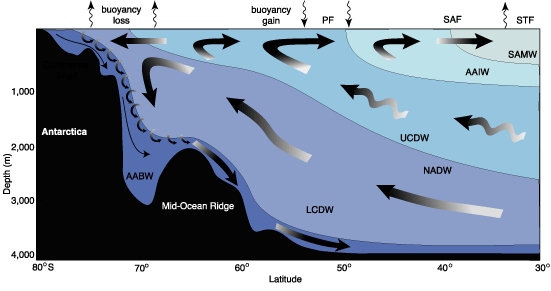
| 15:31, 6 August 2014 | Figure 1.9 - Meridional section through the Southern Ocean overturning circulation.png (file) |  |
38 KB | Maintenance script | Uploaded by import script | 1 |
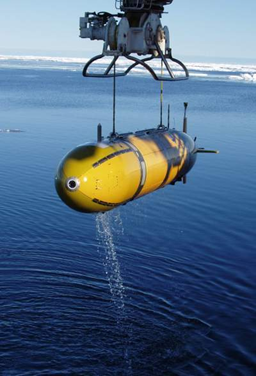
| 15:30, 6 August 2014 | Figure 2.10 - Autosub-2.png (file) |  |
145 KB | Maintenance script | Uploaded by import script | 1 |
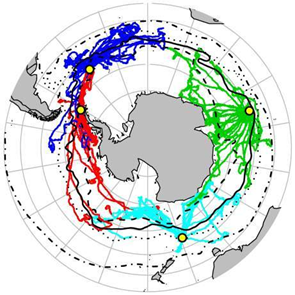
| 15:31, 6 August 2014 | Figure 2.11 - Tracks of instrumented elephant seals.png (file) |  |
129 KB | Maintenance script | Uploaded by import script | 1 |
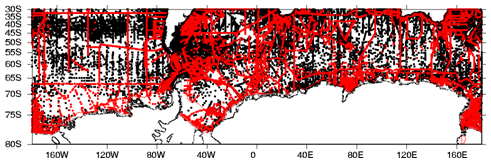
| 15:31, 6 August 2014 | Figure 2.12 - Example figure produced using the Southern Ocean Atlas.png (file) |  |
110 KB | Maintenance script | Uploaded by import script | 1 |
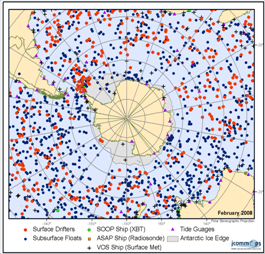
| 15:31, 6 August 2014 | Figure 2.13a - JCOMMOPS Southern Ocean region observations as of February 2008.png (file) |  |
127 KB | Maintenance script | Uploaded by import script | 1 |
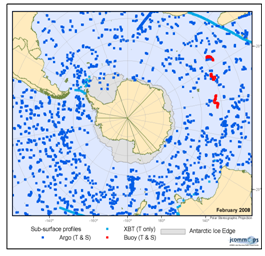
| 15:31, 6 August 2014 | Figure 2.13b - JCOMMOPS Southern Ocean region sub-surface profiles as of February 2008.png (file) |  |
95 KB | Maintenance script | Uploaded by import script | 1 |
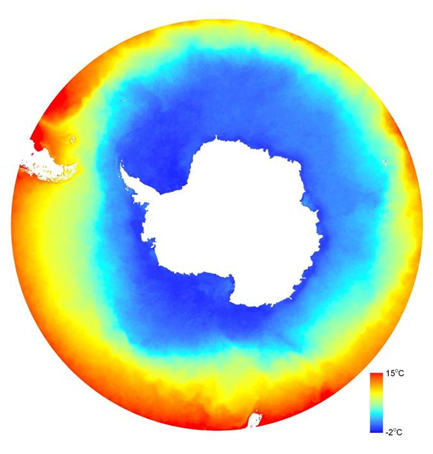
| 15:31, 6 August 2014 | Figure 2.14 - Southern Ocean averaged SST for January from Aqua MODIS sensor.png (file) |  |
205 KB | Maintenance script | Uploaded by import script | 1 |
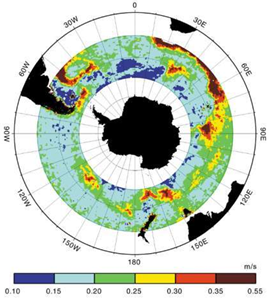
| 15:31, 6 August 2014 | Figure 2.15 - Satellite altimetry showing high eddy kinetic energy in the core of the ACC.png (file) |  |
112 KB | Maintenance script | Uploaded by import script | 1 |
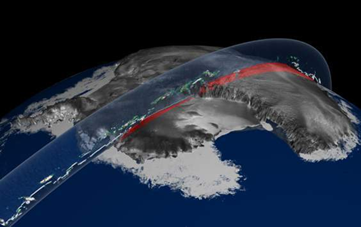
| 15:30, 6 August 2014 | Figure 2.16 - Schematic of a single ICESat repeat track.png (file) |  |
84 KB | Maintenance script | Uploaded by import script | 1 |
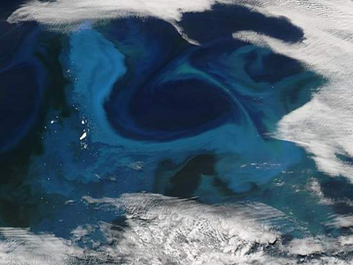
| 15:30, 6 August 2014 | Figure 2.17 - Phytoplankton bloom off South Georgia.png (file) |  |
153 KB | Maintenance script | Uploaded by import script | 1 |
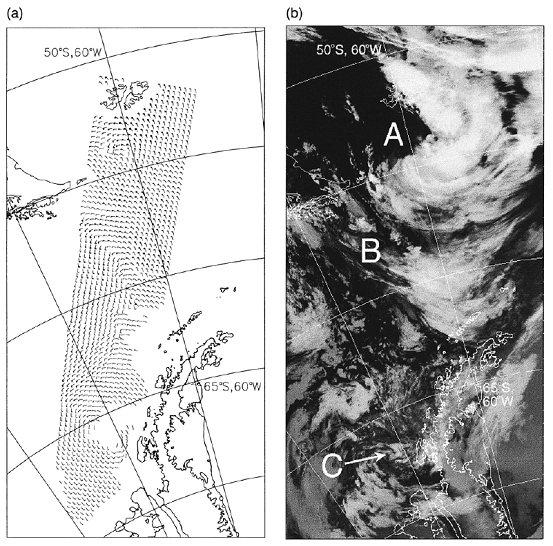
| 15:31, 6 August 2014 | Figure 2.18 - Southern Ocean scatterometer and thermal infrared data acquired on 15 Jan 1995.png (file) |  |
376 KB | Maintenance script | Uploaded by import script | 1 |
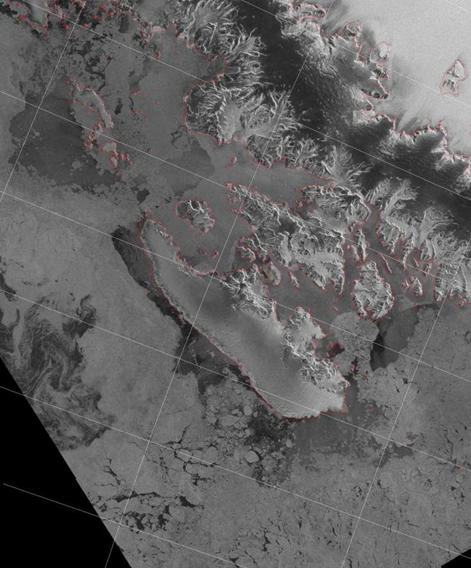
| 15:31, 6 August 2014 | Figure 2.19 - Envisat ASAR image showing sea ice around Adelaide Island, West Antarctic Peninsula.png (file) |  |
353 KB | Maintenance script | Uploaded by import script | 1 |
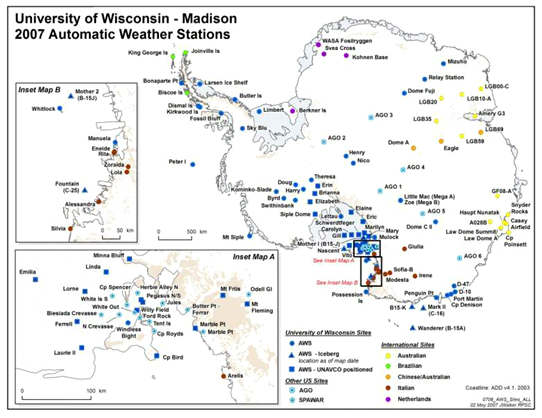
| 15:31, 6 August 2014 | Figure 2.1 - Map of Antarctic AWS sites.png (file) |  |
225 KB | Maintenance script | Uploaded by import script | 1 |
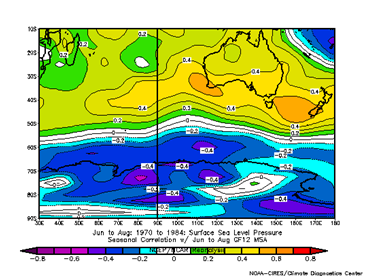
| 15:31, 6 August 2014 | Figure 2.20 - Correlation pattern of JJA MSLP anomalies and MSA variability at GF12.png (file) |  |
91 KB | Maintenance script | Uploaded by import script | 1 |
| 15:31, 6 August 2014 | Figure 2.21 - Twin Otter aircraft fitted with ice penetrating antennas mounted under the wings.png (file) |  |
152 KB | Maintenance script | Uploaded by import script | 1 |
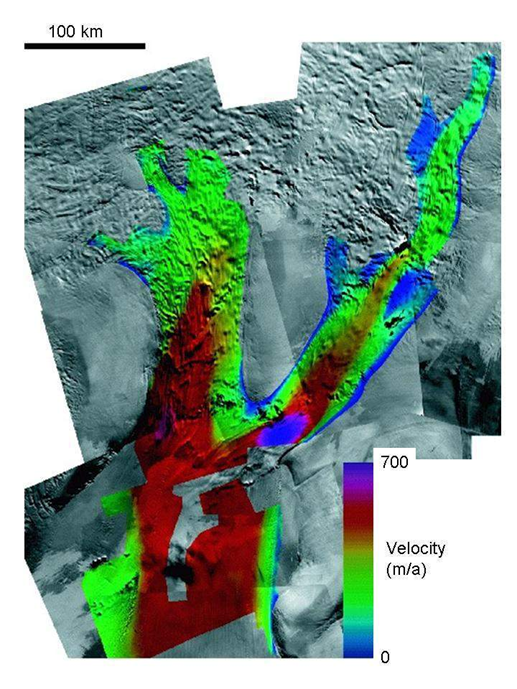
| 15:30, 6 August 2014 | Figure 2.22 - Speed of Bindschadler and MacAyeal Ice Streams, West Antarctica.png (file) |  |
576 KB | Maintenance script | Uploaded by import script | 1 |
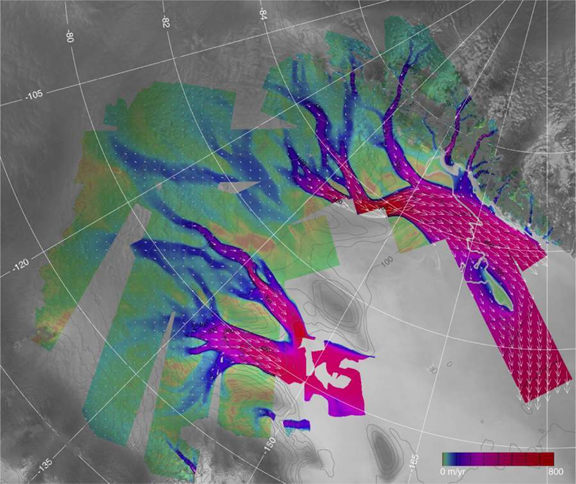
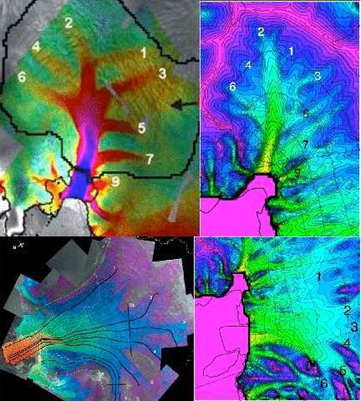
| 15:31, 6 August 2014 | Figure 2.23 - Surface velocity of the Siple and Gould Coast regions of West Antarctica.png (file) |  |
441 KB | Maintenance script | Uploaded by import script | 1 |
| 15:31, 6 August 2014 | Figure 2.24 - Composite of the Antarctic ice sheet surface speed.png (file) |  |
279 KB | Maintenance script | Uploaded by import script | 1 |
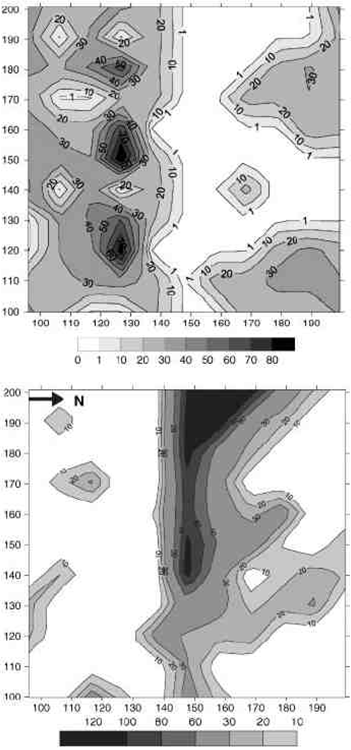
| 19:23, 22 August 2014 | Figure 2.25 - Example of active layer spatial variability.png (file) |  |
221 KB | Tonyp | Acquired higher resolution image | 2 |
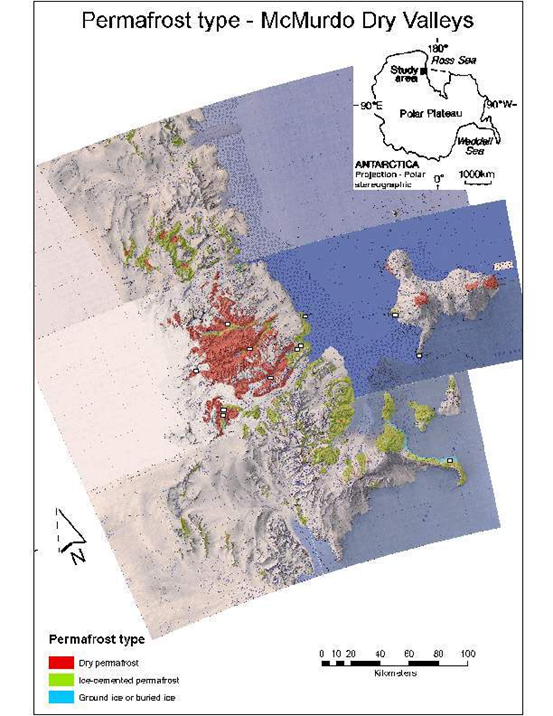
| 15:31, 6 August 2014 | Figure 2.26 - Permafrost distribution by form in the McMurdo Dry Valleys.png (file) |  |
498 KB | Maintenance script | Uploaded by import script | 1 |
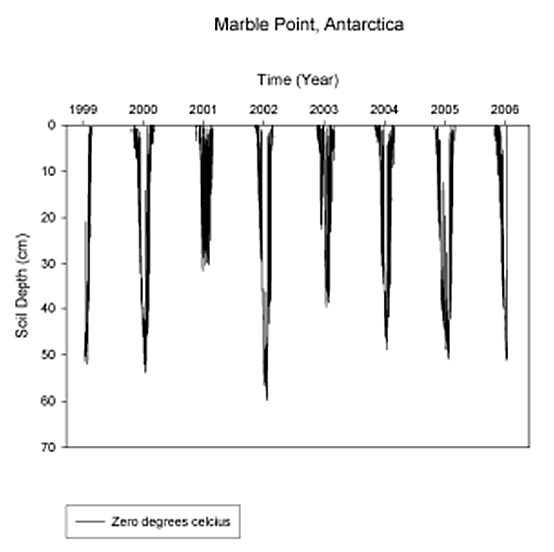
| 15:30, 6 August 2014 | Figure 2.27 - Variation in active layer thickness at Marble Point, 1999-2006.png (file) |  |
54 KB | Maintenance script | Uploaded by import script | 1 |
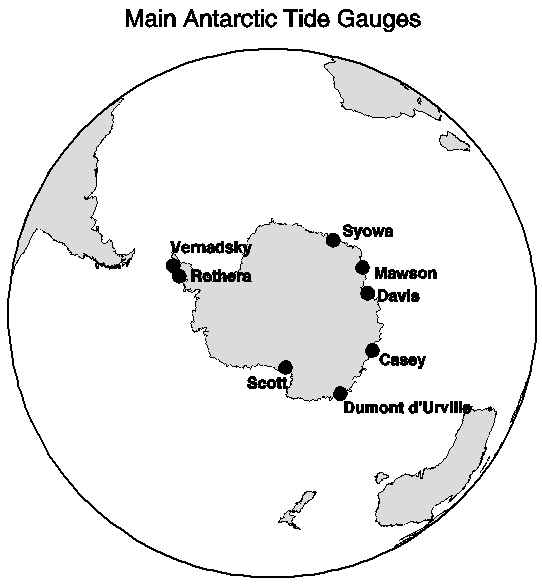
| 15:31, 6 August 2014 | Figure 2.28 - Map of the main Antarctic tide gauges.png (file) |  |
12 KB | Maintenance script | Uploaded by import script | 1 |
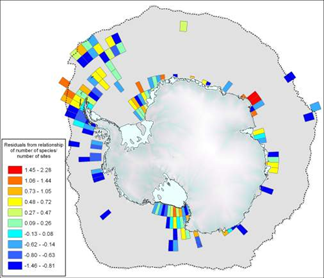
| 15:31, 6 August 2014 | Figure 2.29 - Residual of regression of bivalve species richness against sampling effort, from SOMBASE.png (file) |  |
97 KB | Maintenance script | Uploaded by import script | 1 |
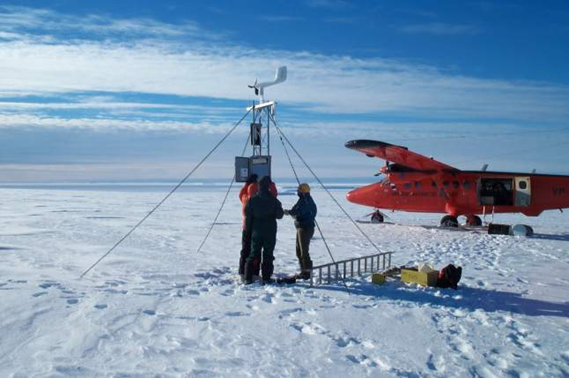
| 15:31, 6 August 2014 | Figure 2.2 - Servicing the AWS at Butler Island.png (file) |  |
299 KB | Maintenance script | Uploaded by import script | 1 |
| 15:31, 6 August 2014 | Figure 2.30 - Commonly used Antarctic terrestrial biogeographic regions.png (file) |  |
161 KB | Maintenance script | Uploaded by import script | 1 |
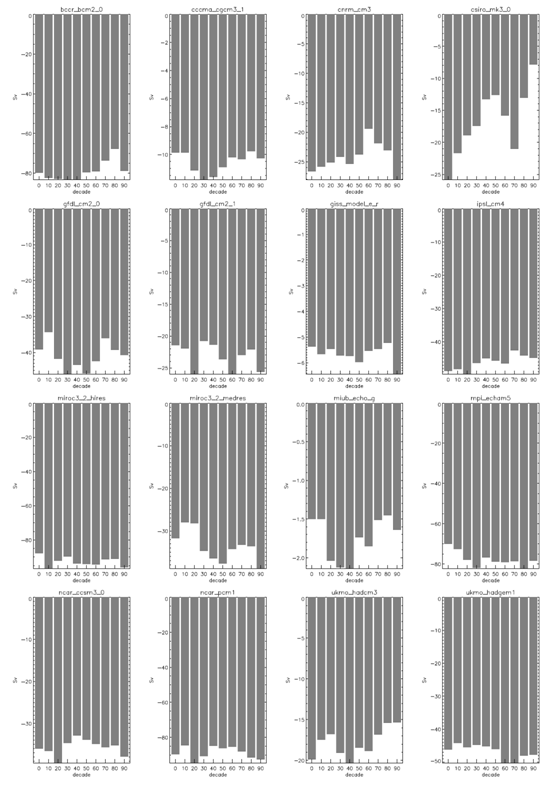
| 15:31, 6 August 2014 | Figure 2.31 - Simulated 20th century Weddell Gyre strength in 16 AR4 climate models.png (file) |  |
106 KB | Maintenance script | Uploaded by import script | 1 |
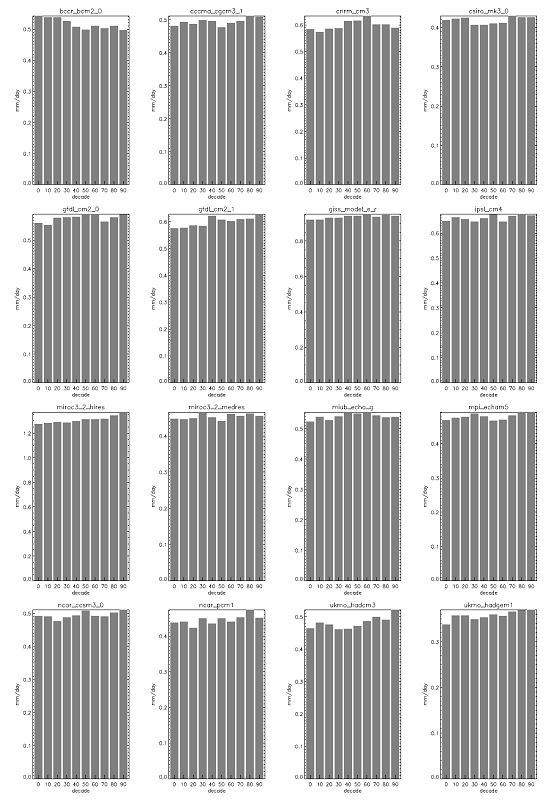
| 15:31, 6 August 2014 | Figure 2.32 - Simulated 20th century Antarctic precipitation in 16 AR4 climate models.png (file) |  |
98 KB | Maintenance script | Uploaded by import script | 1 |
| 15:31, 6 August 2014 | Figure 2.33 - Bed elevations of the Amundsen Sea Embayment.png (file) |  |
342 KB | Maintenance script | Uploaded by import script | 1 |
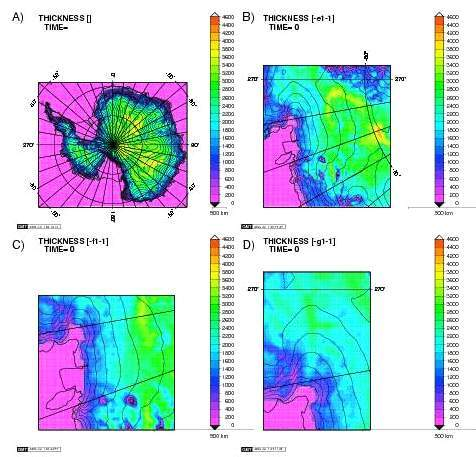
| 15:31, 6 August 2014 | Figure 2.34 - Nested grids, with ice thickness fields, for the UMISM.png (file) |  |
315 KB | Maintenance script | Uploaded by import script | 1 |
| 15:31, 6 August 2014 | Figure 2.35 - Modelled and observed surface velocities for Pine Island and Thwaites Glaciers.png (file) |  |
338 KB | Maintenance script | Uploaded by import script | 1 |
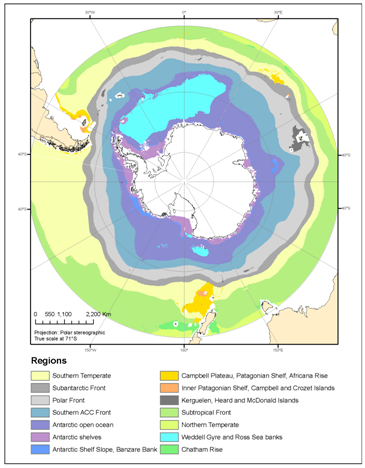
| 15:30, 6 August 2014 | Figure 2.36 - Primary regionalisation of the Southern Ocean.png (file) |  |
116 KB | Maintenance script | Uploaded by import script | 1 |
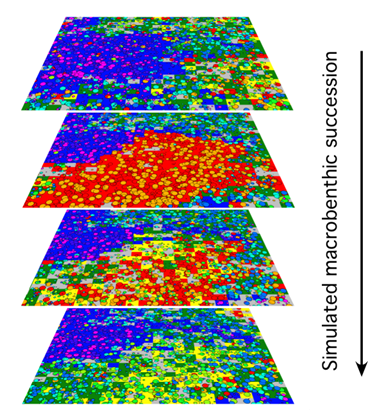
| 15:31, 6 August 2014 | Figure 2.37 - Simulation of a benthic succession.png (file) |  |
227 KB | Maintenance script | Uploaded by import script | 1 |
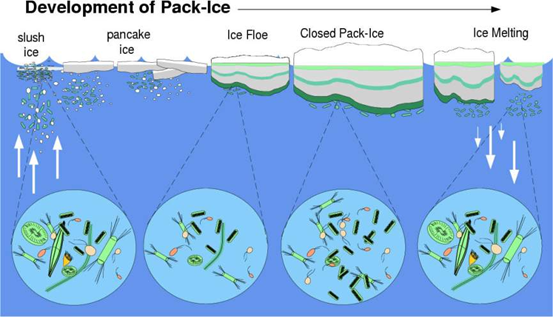
| 15:31, 6 August 2014 | Figure 2.38 - Schematic of incorporation of biological material into Antarctic pack ice.png (file) |  |
207 KB | Maintenance script | Uploaded by import script | 1 |
First page |
Previous page |
 Next page |
Last page |