File list
Jump to:
navigation
,
search
This special page shows all uploaded files.
File list
Items per page:
20
50
100
250
500
Search for media name:
Username:
Include old versions of images
Date
Name
Thumbnail
Size
User
Description
Versions
15:31, 6 August 2014
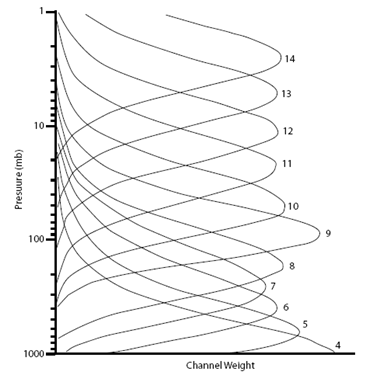
Figure 2.5 - The weighting functions for channels 4-14 of the AMSU-A instrument.png
(
file
)
60 KB
Maintenance script
Uploaded by import script
1
15:31, 6 August 2014
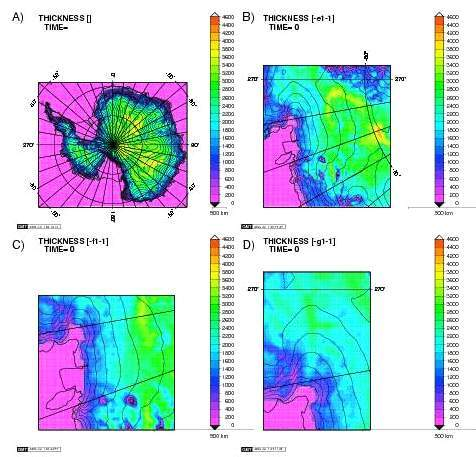
Figure 2.34 - Nested grids, with ice thickness fields, for the UMISM.png
(
file
)
315 KB
Maintenance script
Uploaded by import script
1
15:31, 6 August 2014
Figure 2.24 - Composite of the Antarctic ice sheet surface speed.png
(
file
)
279 KB
Maintenance script
Uploaded by import script
1
15:31, 6 August 2014
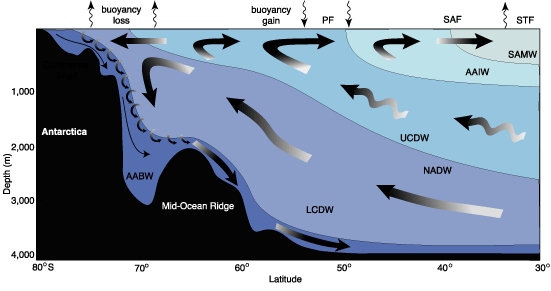
Figure 1.9 - Meridional section through the Southern Ocean overturning circulation.png
(
file
)
38 KB
Maintenance script
Uploaded by import script
1
15:31, 6 August 2014
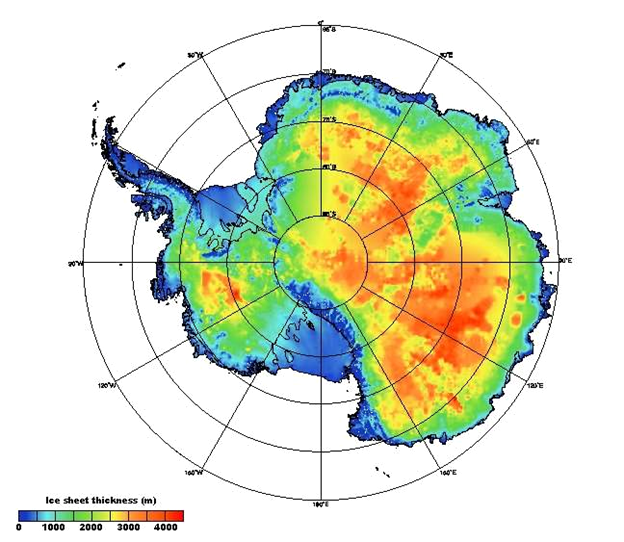
Figure 1.5 - Antarctic ice thickness.png
(
file
)
347 KB
Maintenance script
Uploaded by import script
1
15:31, 6 August 2014
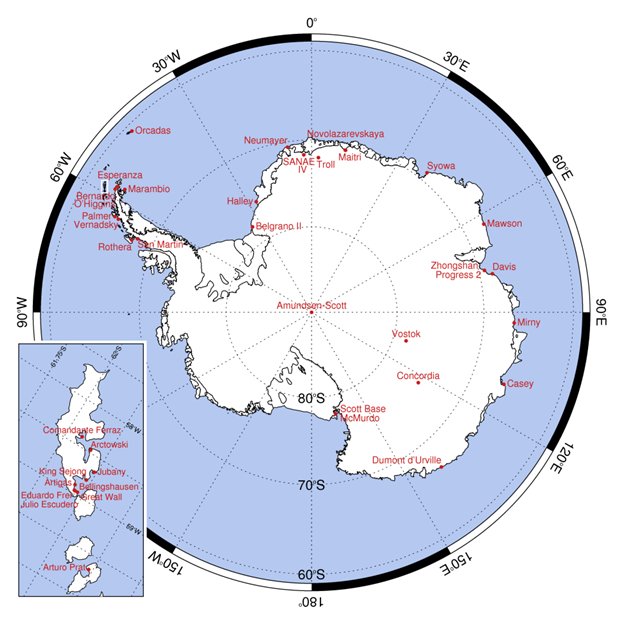
Figure 1.1b - Map of Antarctic stations.png
(
file
)
210 KB
Maintenance script
Uploaded by import script
1
15:30, 6 August 2014
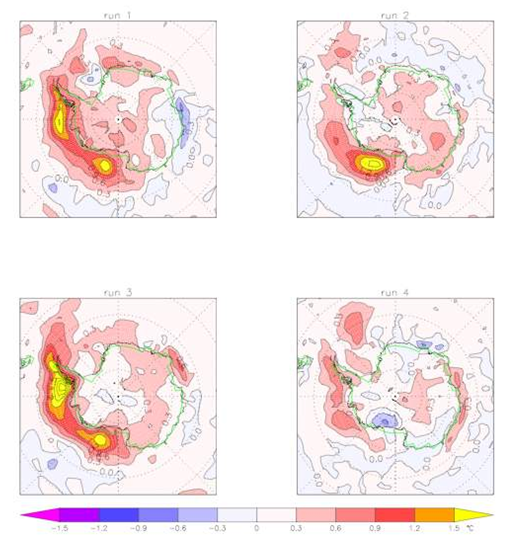
Figure 5.3 - Surface temperature trends for 1960-2000 for winter (JJA) for the MPI ECHAM5 model.png
(
file
)
340 KB
Maintenance script
Uploaded by import script
1
15:30, 6 August 2014
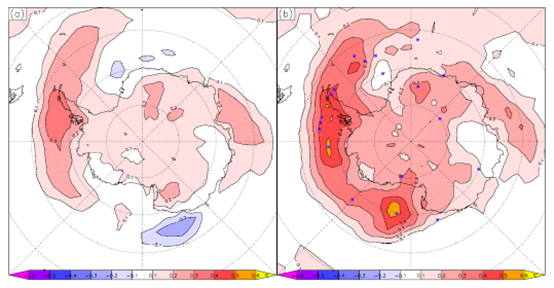
Figure 5.2 - Temperature trends for 1960-2000 for winter (JJA).png
(
file
)
145 KB
Maintenance script
Uploaded by import script
1
15:30, 6 August 2014
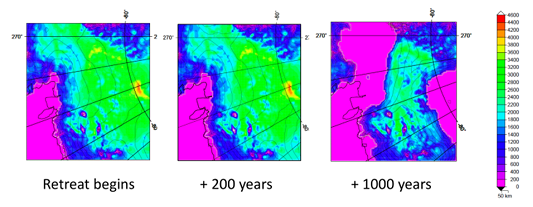
Figure 5.18 - UMISM model ice thickness and surface elevation changes for the Amundsen Sea sector.png
(
file
)
116 KB
Maintenance script
Uploaded by import script
1
15:30, 6 August 2014
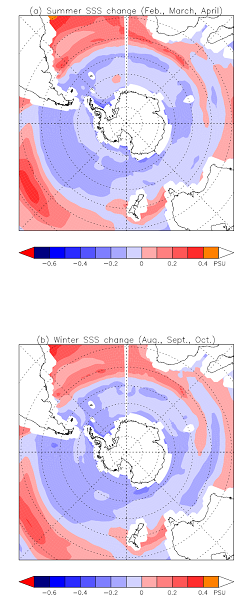
Figure 5.15(ii) - Sea surface salinity change for summer and winter, between 2000 and 2100.png
(
file
)
133 KB
Maintenance script
Uploaded by import script
1
15:30, 6 August 2014
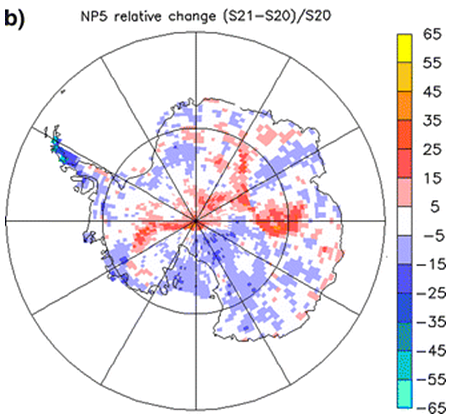
Figure 5.10 - 21st century change in days with precipitation exceeding five times the daily mean.png
(
file
)
172 KB
Maintenance script
Uploaded by import script
1
15:30, 6 August 2014
Figure 4.7b - Vorticity variance for winter 1958-2002.png
(
file
)
78 KB
Maintenance script
Uploaded by import script
1
15:30, 6 August 2014
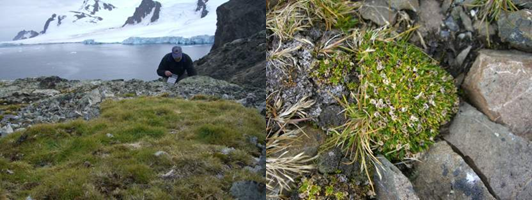
Figure 4.61 - Antarctic flowering plants - Deschampsia antarctica and Colobanthus quitensis.png
(
file
)
221 KB
Maintenance script
Uploaded by import script
1
15:30, 6 August 2014
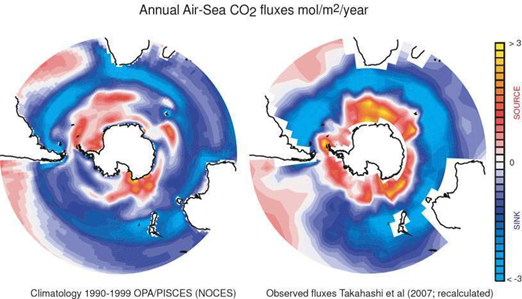
Figure 4.56 - Annual mean uptake of air-sea CO2 fluxes as calculated from OPA-PISCES 1990-1999.png
(
file
)
218 KB
Maintenance script
Uploaded by import script
1
15:30, 6 August 2014
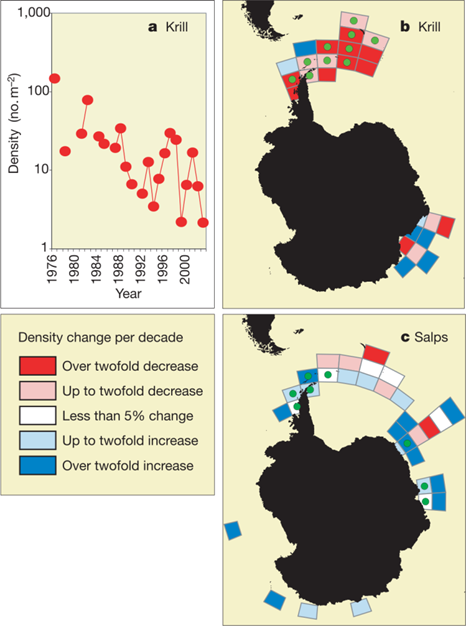
Figure 4.47 - Temporal change of krill and salps.png
(
file
)
125 KB
Maintenance script
Uploaded by import script
1
15:30, 6 August 2014
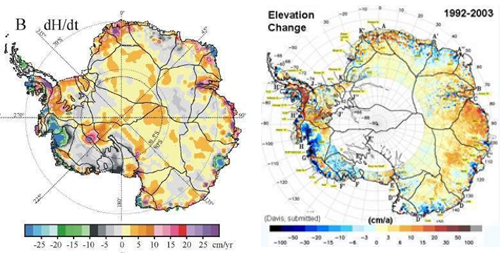
Figure 4.34 - Antarctic ice sheet elevation change measured by satellite altimetry.png
(
file
)
199 KB
Maintenance script
Uploaded by import script
1
15:30, 6 August 2014
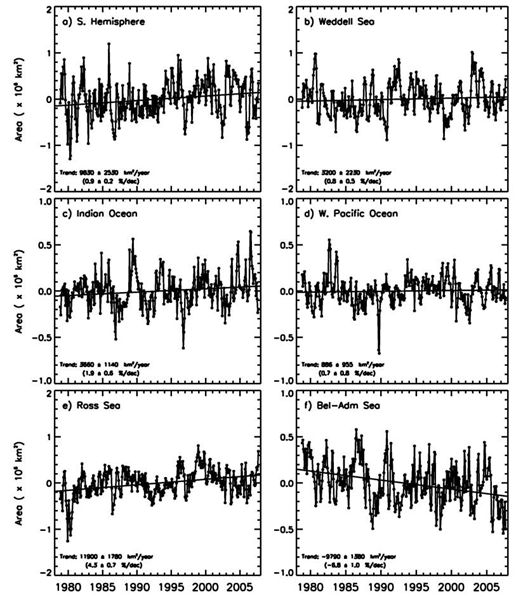
Figure 4.32 - Southern hemisphere regional sea ice extent monthly anomalies and trend lines.png
(
file
)
229 KB
Maintenance script
Uploaded by import script
1
15:30, 6 August 2014
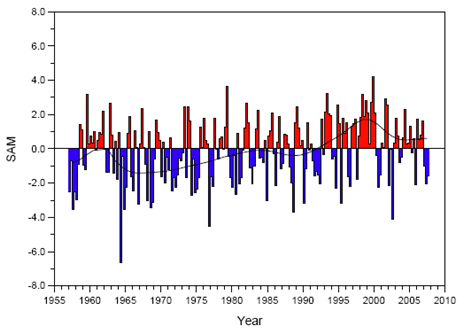
Figure 4.2 - Seasonal values of the SAM index calculated from station data.png
(
file
)
35 KB
Maintenance script
Uploaded by import script
1
15:30, 6 August 2014
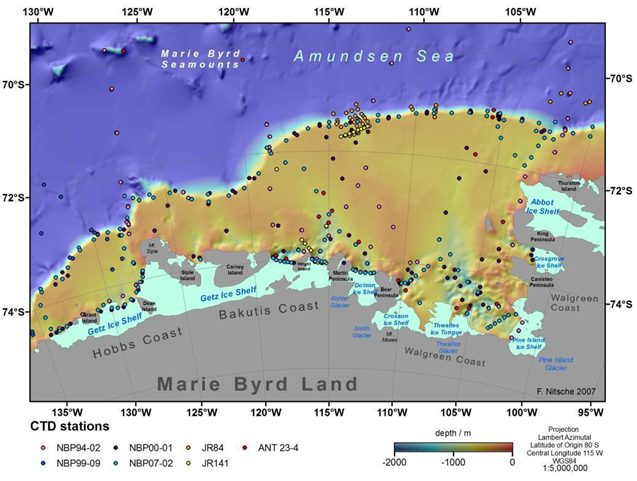
Figure 4.25 - Amundsen Sea bathymetric chart and hydrographic stations of different cruises.png
(
file
)
343 KB
Maintenance script
Uploaded by import script
1
15:30, 6 August 2014
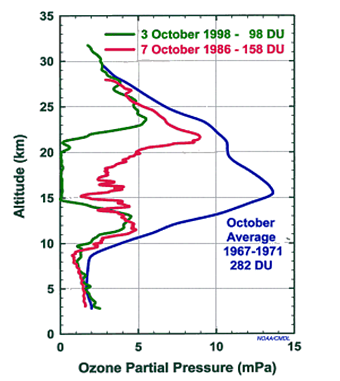
Figure 4.14 - South pole ozone profiles.png
(
file
)
73 KB
Maintenance script
Uploaded by import script
1
15:30, 6 August 2014
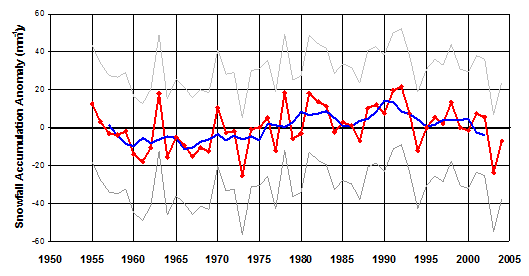
Figure 4.12 - Annual Antarctic snowfall accumulation anomalies.png
(
file
)
11 KB
Maintenance script
Uploaded by import script
1
15:30, 6 August 2014
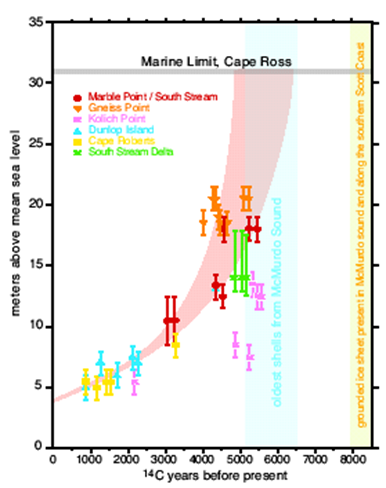
Figure 3.16 - Relative sea level curve for the Ross Sea based on radiocarbon dates.png
(
file
)
87 KB
Maintenance script
Uploaded by import script
1
15:30, 6 August 2014
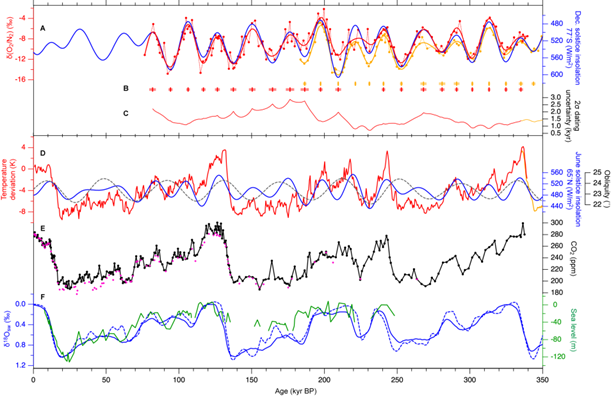
Figure 3.10 - Accurately dated Antarctic ice-core records and the comparison with sea level proxies.png
(
file
)
118 KB
Maintenance script
Uploaded by import script
1
15:30, 6 August 2014
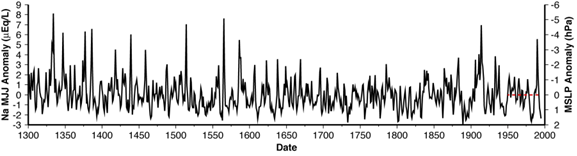
Figure 2.8 - Sodium May-July anomalies, 1300-1995.png
(
file
)
46 KB
Maintenance script
Uploaded by import script
1
15:30, 6 August 2014
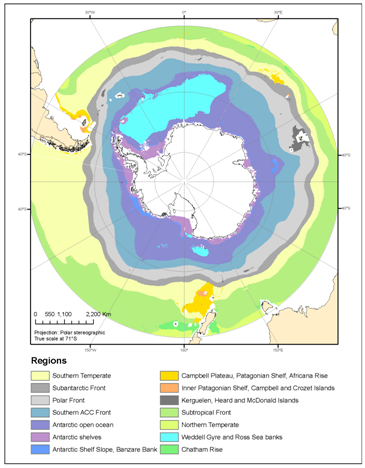
Figure 2.36 - Primary regionalisation of the Southern Ocean.png
(
file
)
116 KB
Maintenance script
Uploaded by import script
1
15:30, 6 August 2014
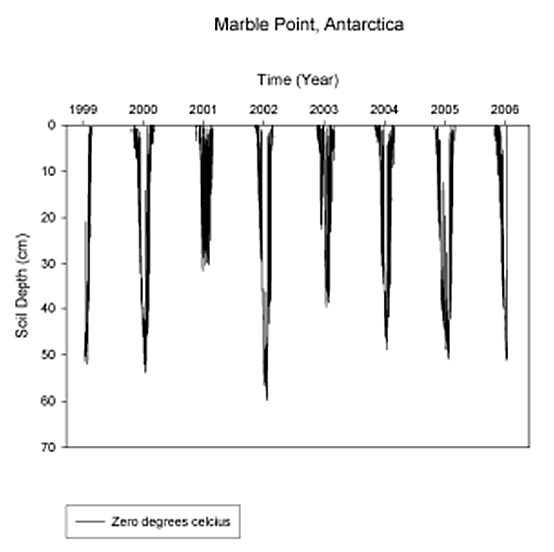
Figure 2.27 - Variation in active layer thickness at Marble Point, 1999-2006.png
(
file
)
54 KB
Maintenance script
Uploaded by import script
1
15:30, 6 August 2014
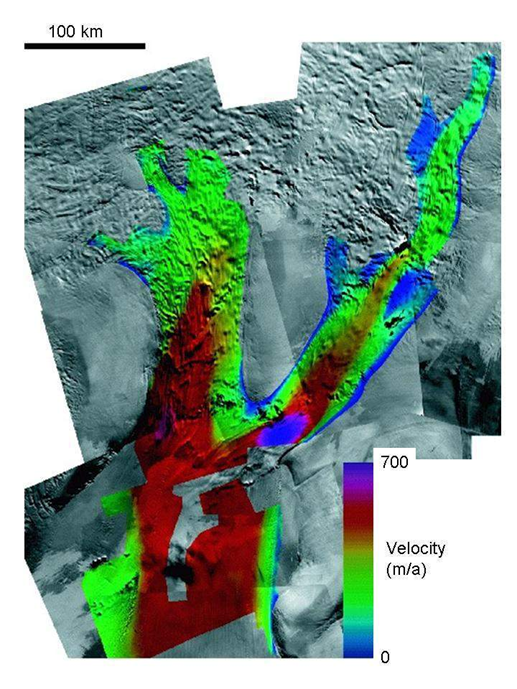
Figure 2.22 - Speed of Bindschadler and MacAyeal Ice Streams, West Antarctica.png
(
file
)
576 KB
Maintenance script
Uploaded by import script
1
15:30, 6 August 2014
Figure 2.16 - Schematic of a single ICESat repeat track.png
(
file
)
84 KB
Maintenance script
Uploaded by import script
1
15:30, 6 August 2014
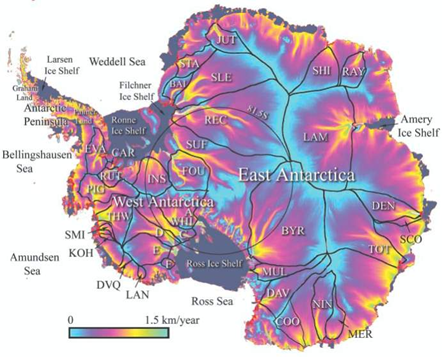
Figure 1.6 - Antarctic ice sheet balance velocity.png
(
file
)
259 KB
Maintenance script
Uploaded by import script
1
15:30, 6 August 2014
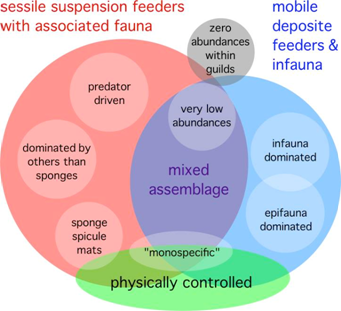
Figure 1.16 - Classification of macro-benthic communities on the continental Antarctic shelf.png
(
file
)
117 KB
Maintenance script
Uploaded by import script
1
15:30, 6 August 2014
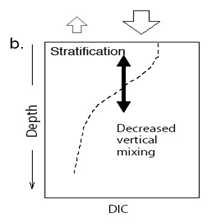
Figure 5.22b - Expected impact of sea surface warming on ocean dissolved inorganic carbon.png
(
file
)
14 KB
Maintenance script
Uploaded by import script
1
15:30, 6 August 2014
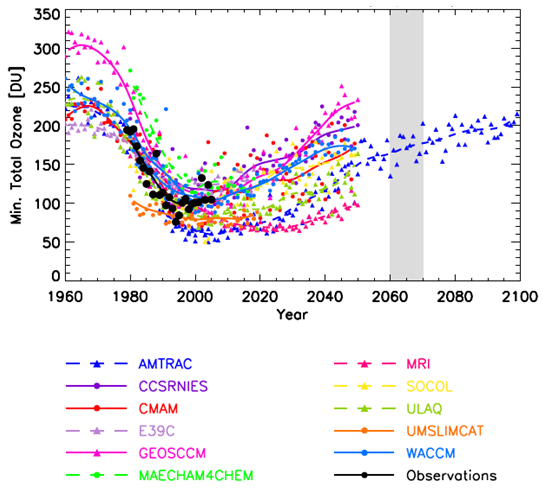
Figure 5.11 - Observations and model predictions of minimum September to October total column ozone.png
(
file
)
113 KB
Maintenance script
Uploaded by import script
1
15:30, 6 August 2014
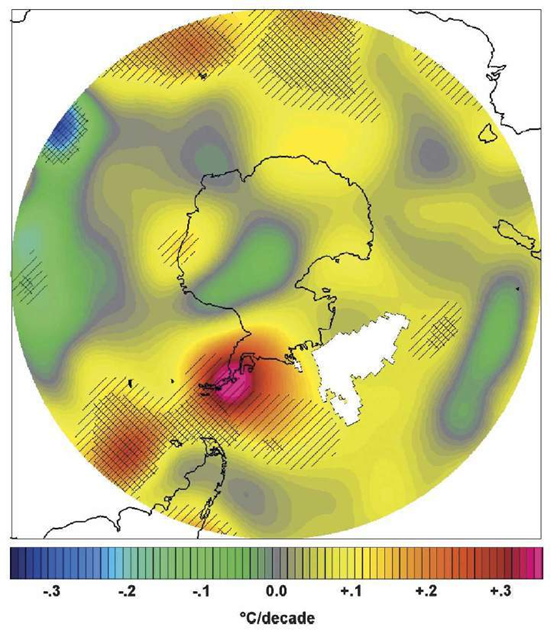
Figure 4.8b - Linear trends of annual mean surface air temperature for 1958-2002.png
(
file
)
458 KB
Maintenance script
Uploaded by import script
1
15:30, 6 August 2014
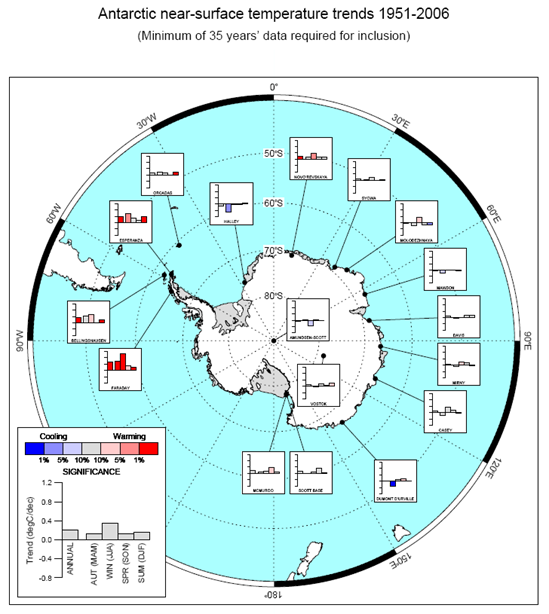
Figure 4.8a - Near-surface temperature trends for 1951-2006 based on station data.png
(
file
)
166 KB
Maintenance script
Uploaded by import script
1
15:30, 6 August 2014
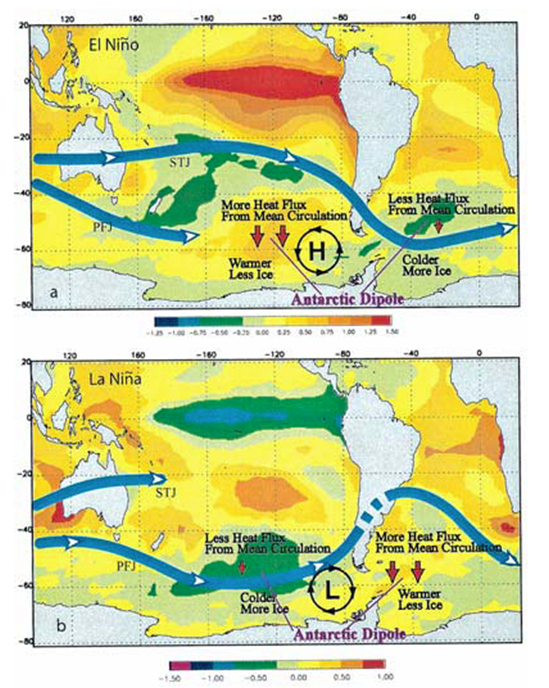
Figure 4.4 - El Nino and La Nina SST anomaly composites and schematic effects.png
(
file
)
669 KB
Maintenance script
Uploaded by import script
1
15:30, 6 August 2014
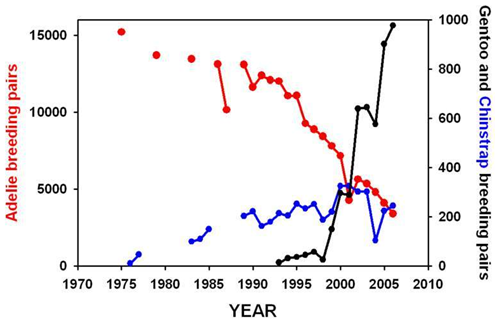
Figure 4.48 - Population trends for three penguin species in the vicinity of Anvers Island.png
(
file
)
88 KB
Maintenance script
Uploaded by import script
1
15:30, 6 August 2014
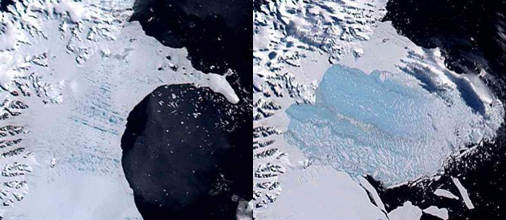
Figure 4.37 - Rapid disintegration of Larsen B ice shelf.png
(
file
)
205 KB
Maintenance script
Uploaded by import script
1
15:30, 6 August 2014
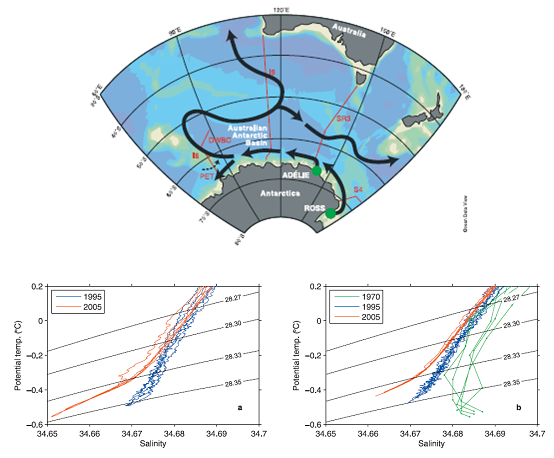
Figure 4.24 - Map of repeat section locations and deep potential temperature-salinity curves.png
(
file
)
131 KB
Maintenance script
Uploaded by import script
1
15:30, 6 August 2014
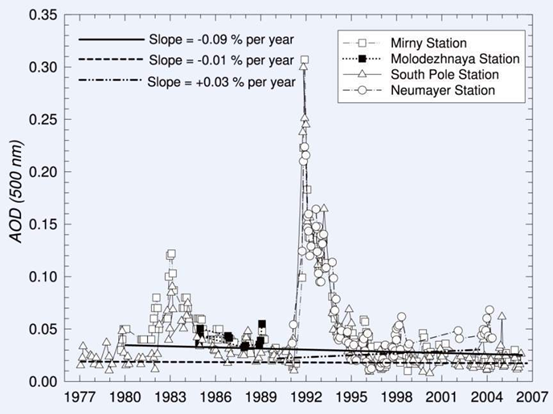
Figure 4.20 - Mean aerosol optical depth (500 nm) by month.png
(
file
)
180 KB
Maintenance script
Uploaded by import script
1
15:30, 6 August 2014
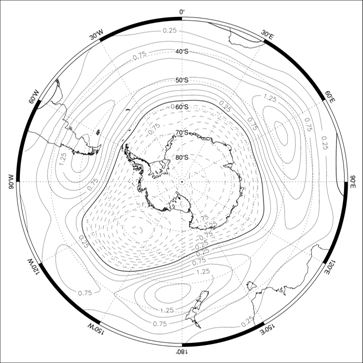
Figure 4.1 - Austral summer gridded 500hPa geopotential height monthly anomalies for 1989-2008.png
(
file
)
106 KB
Maintenance script
Uploaded by import script
1
15:30, 6 August 2014
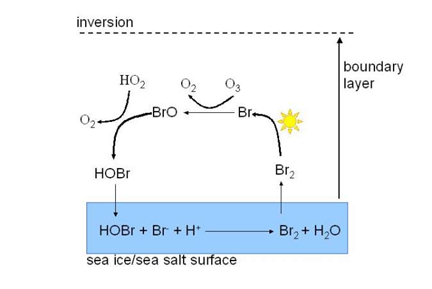
Figure 4.19 - A schematic representation of the Bromine Explosion.png
(
file
)
42 KB
Maintenance script
Uploaded by import script
1
15:30, 6 August 2014
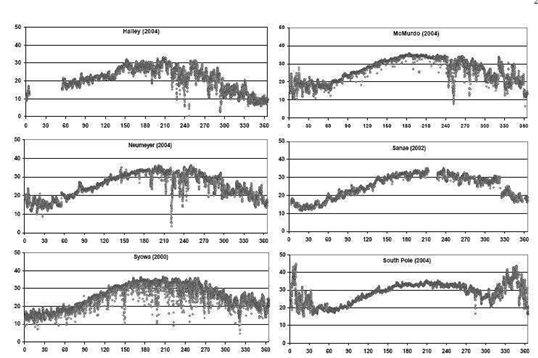
Figure 4.18 - Surface ozone by day for Halley, MacMurdo, Neumayer, Sanae, Syowa and South Pole.png
(
file
)
131 KB
Maintenance script
Uploaded by import script
1
15:30, 6 August 2014
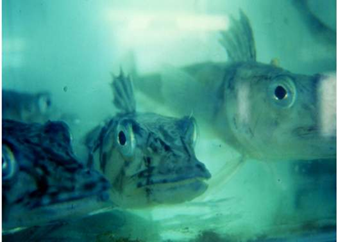
Figure 3.30 - Icefishes (Chionodraco hamatus).png
(
file
)
109 KB
Maintenance script
Uploaded by import script
1
15:30, 6 August 2014
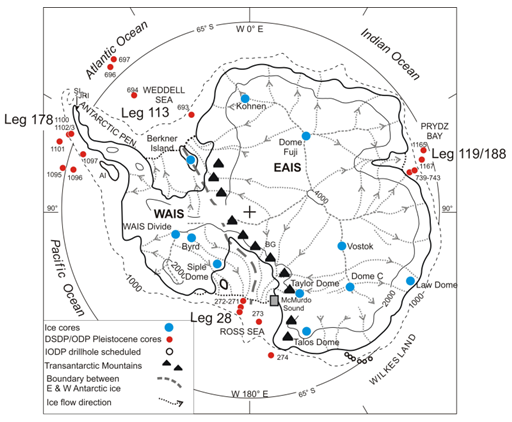
Figure 3.1 - Map of Antarctica showing locations of selected deep ice and sediment cores.png
(
file
)
151 KB
Maintenance script
Uploaded by import script
1
15:30, 6 August 2014
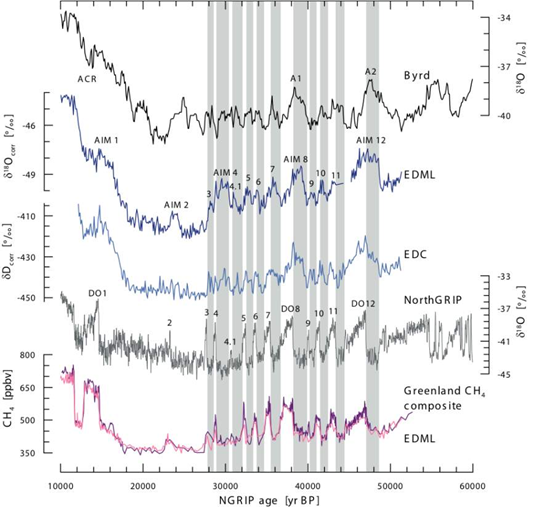
Figure 3.13 - Methane and d18O records covering the period 10-60 ka ago.png
(
file
)
185 KB
Maintenance script
Uploaded by import script
1
15:30, 6 August 2014
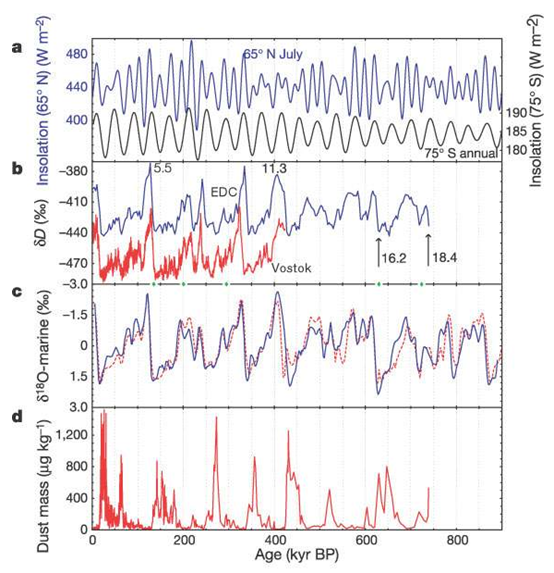
Figure 3.11 - Insolation, EPICA Dome C delta-D and ice core dust, and marine oxygen isotope record.png
(
file
)
333 KB
Maintenance script
Uploaded by import script
1
15:30, 6 August 2014
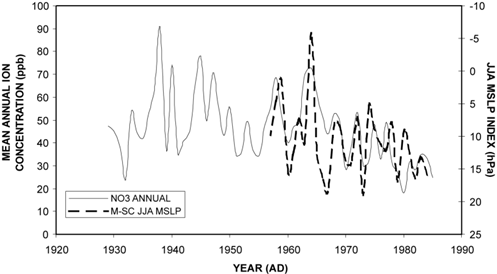
Figure 2.6 - Nitrate concentration at GD09 and JJA Macquarie Island-Scott Base MSLP gradient.png
(
file
)
47 KB
Maintenance script
Uploaded by import script
1
15:30, 6 August 2014
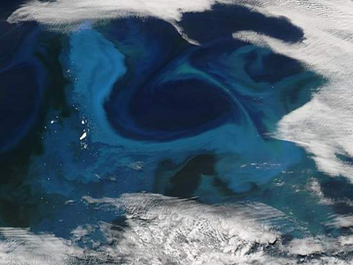
Figure 2.17 - Phytoplankton bloom off South Georgia.png
(
file
)
153 KB
Maintenance script
Uploaded by import script
1
15:30, 6 August 2014
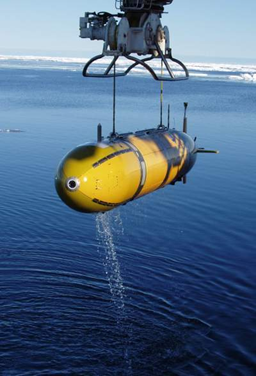
Figure 2.10 - Autosub-2.png
(
file
)
145 KB
Maintenance script
Uploaded by import script
1
15:30, 6 August 2014
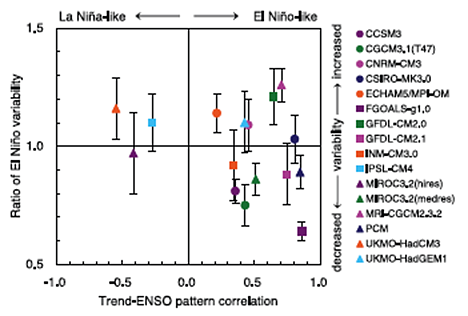
Figure 5.4 - Change in average tropical Pacific SSTs and El Nino variability simulated by AOGCMs.png
(
file
)
70 KB
Maintenance script
Uploaded by import script
1
First page
Previous page
Next page
Last page
Navigation menu
Personal tools
Log in
Namespaces
Special page
Variants
Views
Actions
Search
Navigation
Home
Contents
About ACCE
Key points
The Antarctic environment in the global system
Observations, data accuracy and tools
The pre-instrumental period
The instrumental period
The next 100 years
Recommendations
Help
Help
Tools
Special pages
Printable version


_for_the_MPI_ECHAM5_model.png)
.png)

_-_Sea_surface_salinity_change_for_summer_and_winter,_between_2000_and_2100.png)


_by_month.png)


.png)


