File:Figure 5.9 - 21st century change in the annual cycle of Antarctic precipitation under the A1B scenario.png
From ACCE
Revision as of 15:31, 6 August 2014 by Maintenance script (Talk)
No higher resolution available.
Figure_5.9_-_21st_century_change_in_the_annual_cycle_of_Antarctic_precipitation_under_the_A1B_scenario.png (437 × 453 pixels, file size: 50 KB, MIME type: image/png)
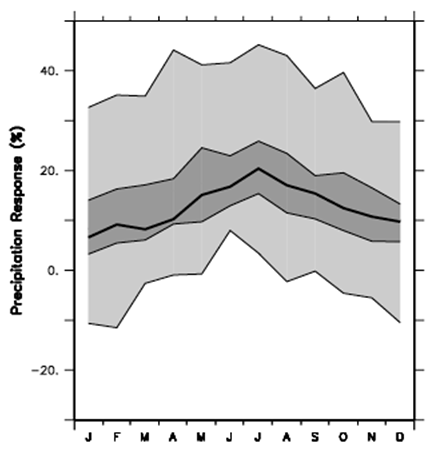
Annual cycle of percentage precipitation changes (averaged over the Antarctic continent) for 2080-2099 minus 1980-1999, under the A1B scenario. Thick lines represent the ensemble median of the 21 Multi-model Data Set models. The dark grey area represents the 25% and 75% quartile values among the 21 models, while the light grey area shows the total range of the models.
File history
Click on a date/time to view the file as it appeared at that time.
| Date/Time | Thumbnail | Dimensions | User | Comment | |
|---|---|---|---|---|---|
| current | 15:31, 6 August 2014 | | 437 × 453 (50 KB) | Maintenance script (Talk) | Uploaded by import script |
- You cannot overwrite this file.
File usage
The following page links to this file: