File:Figure 5.14 - Zonal mean difference between observed and simulated temperature and salinity, 1981-2000.png
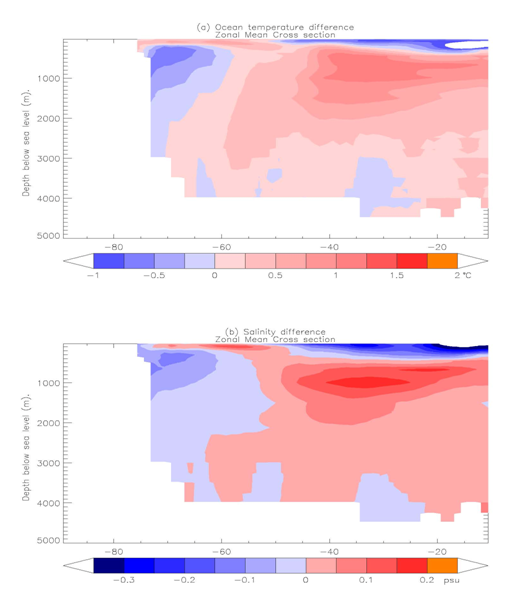
The zonal mean difference between observed (a) temperature (°C) and (b) salinity (psu) and the average of 19 CGCMS simulations for the period 1981-2000 (20C3M simulation), superimposed on the bathymetry. The observations are taken from World Ocean Atlas (2001, http://www.nodc.noaa.gov/OC5/WOA01/pr_woa01.html). The 19 models for which sufficient data for the 20C3M runs was available are CCCMA CGCM3.1, CCCMA CGCM3.1-T63, CNRM CM3, CSIRO MK3.0, CSIRO MK3.5, GFDL CM2.0, GFDL CM2.1, GISS_AOM, GISS MODEL E R, INGV ECHAM4, IPSL CM4, MIROC3 2 HIRES, MIROC3 2 MEDRES, MIUB ECHO G, MPI ECHAM5, MRI CGCM2-3_2A, NCAR CCSM3_0, NCAR_PCM1, AND UKMO HADCM3.
File history
Click on a date/time to view the file as it appeared at that time.
| Date/Time | Thumbnail | Dimensions | User | Comment | |
|---|---|---|---|---|---|
| current | 15:31, 6 August 2014 | | 514 × 597 (107 KB) | Maintenance script (Talk) | Uploaded by import script |
- You cannot overwrite this file.
File usage
The following page links to this file: