File:Figure 4.7b - Vorticity variance for winter 1958-2002.png
From ACCE
Revision as of 15:30, 6 August 2014 by Maintenance script (Talk)
No higher resolution available.
Figure_4.7b_-_Vorticity_variance_for_winter_1958-2002.png (277 × 275 pixels, file size: 78 KB, MIME type: image/png)
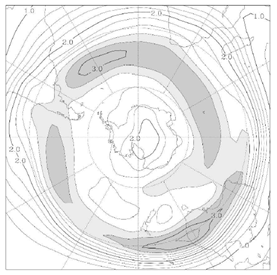
Bandpass-filtered (2-6 day) variance converted to standard deviation for a250 for winter 1958-2002. This quantity provides a measure of storm activity and indicates the tracks of major storms. From Hoskins and Hodges (2005[1]). The shaded areas show the large atmospheric variability associated with the frequent passage of depressions.
- ↑ Hoskins, B.J. and Hodges, K. 2005. A new perspective on southern hemisphere winter storm tracks, Journal of Climate, 18, 4108-4129.
File history
Click on a date/time to view the file as it appeared at that time.
| Date/Time | Thumbnail | Dimensions | User | Comment | |
|---|---|---|---|---|---|
| current | 15:30, 6 August 2014 | | 277 × 275 (78 KB) | Maintenance script (Talk) | Uploaded by import script |
- You cannot overwrite this file.
File usage
The following page links to this file: