File:Figure 4.6 - Normalized temporal variations at 140 degrees west of total, stationary and eastward SST.png
From ACCE
Revision as of 15:31, 6 August 2014 by Maintenance script (Talk)
No higher resolution available.
Figure_4.6_-_Normalized_temporal_variations_at_140_degrees_west_of_total,_stationary_and_eastward_SST.png (360 × 314 pixels, file size: 108 KB, MIME type: image/png)
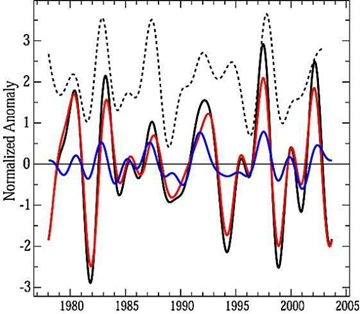
Temporal variations at 140°W of the total (black line), stationary (red line), and eastward (blue line) SST. Values are normalized by a standard deviation of the total SST. The Southern Oscillation Index (a measure of the phase of the El Niño – Southern Oscillation) is shown by a micro-dashed line, but with its sign being reversed and its zero axis being displaced by +2 to better compare with peaks of SST (Park Y. et al., 2004).
File history
Click on a date/time to view the file as it appeared at that time.
| Date/Time | Thumbnail | Dimensions | User | Comment | |
|---|---|---|---|---|---|
| current | 15:31, 6 August 2014 | | 360 × 314 (108 KB) | Maintenance script (Talk) | Uploaded by import script |
- You cannot overwrite this file.
File usage
The following page links to this file: