File:Figure 4.47 - Temporal change of krill and salps.png
From ACCE
Revision as of 15:31, 6 August 2014 by Maintenance script (Talk)
No higher resolution available.
Figure_4.47_-_Temporal_change_of_krill_and_salps.png (466 × 626 pixels, file size: 125 KB, MIME type: image/png)
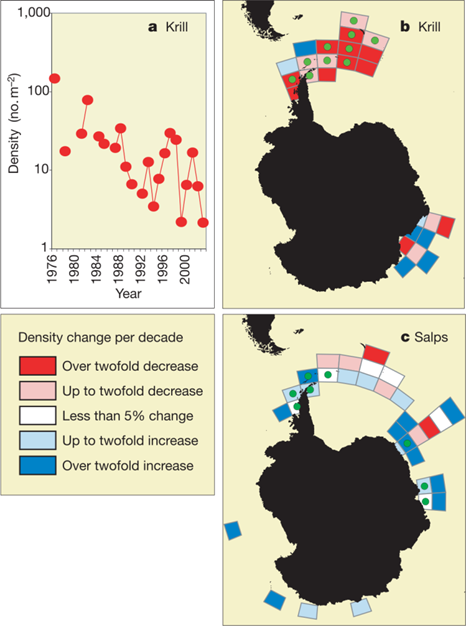
Temporal change of krill and salps. a, Krill density in the southwest Atlantic sector, 30° – 70°W. Illustrated temporal trends include b, post 1976 krill data from scientific trawls; c, 1926-2003 circumpolar salp data. Green spots denote grid cells useable in a spatio-temporal model, with data subdivided according to sampling method (Atkinson et al., 2004[1]). This model revealed significant decreases in krill density within the southwest Atlantic sector since 1976 and a significant increase in salp densities at high latitudes since 1926. Reprinted by permission from Macmillan Publishers Ltd: Nature (Atkinson et al., 2004[1]), © 2004
File history
Click on a date/time to view the file as it appeared at that time.
| Date/Time | Thumbnail | Dimensions | User | Comment | |
|---|---|---|---|---|---|
| current | 15:30, 6 August 2014 | | 466 × 626 (125 KB) | Maintenance script (Talk) | Uploaded by import script |
- You cannot overwrite this file.
File usage
The following page links to this file: