File:Figure 4.39 - Recent and longer term thinning of the Amundsen Sea Embayment sector ice sheet.png
From ACCE
Revision as of 15:31, 6 August 2014 by Maintenance script (Talk)
No higher resolution available.
Figure_4.39_-_Recent_and_longer_term_thinning_of_the_Amundsen_Sea_Embayment_sector_ice_sheet.png (372 × 404 pixels, file size: 271 KB, MIME type: image/png)
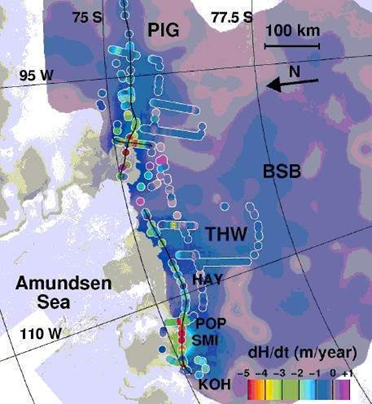
Recent and longer term thinning of the Amundsen Sea Embayment sector ice sheet. Regional colours represent rate of elevation change derived from two decades of satellite radar altimetry. Circled colours represent recent elevation changes derived from airborne altimetry flown in 2002. The difference in the two surveys indicates a recent increase in the rate of thinning (from Thomas et al., 2004b[1])
- ↑ Thomas, R.H., Rignot, E., Kanagaratnam, P., Krabill, W. and Casassa, G. 2004b, Force perturbation analysis of Pine Island Glacier suggests cause for recent acceleration, Ann. Glaciol., 39, 133-138.
File history
Click on a date/time to view the file as it appeared at that time.
| Date/Time | Thumbnail | Dimensions | User | Comment | |
|---|---|---|---|---|---|
| current | 15:31, 6 August 2014 | | 372 × 404 (271 KB) | Maintenance script (Talk) | Uploaded by import script |
- You cannot overwrite this file.
File usage
The following page links to this file: