File:Figure 4.2 - Seasonal values of the SAM index calculated from station data.png
From ACCE
Revision as of 15:30, 6 August 2014 by Maintenance script (Talk)
No higher resolution available.
Figure_4.2_-_Seasonal_values_of_the_SAM_index_calculated_from_station_data.png (464 × 334 pixels, file size: 35 KB, MIME type: image/png)
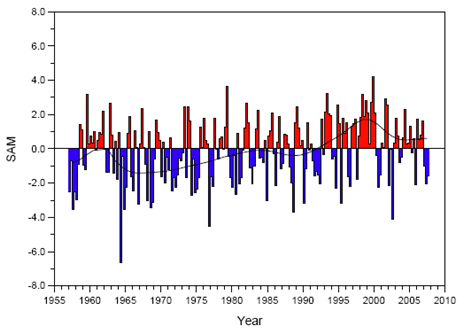
Seasonal values of the SAM index calculated from station data (Marshall, 2003[1]). The smooth black curve shows decadal variations. This is an updated version of Figure 3.32 from IPCC (2007[2]).
File history
Click on a date/time to view the file as it appeared at that time.
| Date/Time | Thumbnail | Dimensions | User | Comment | |
|---|---|---|---|---|---|
| current | 15:30, 6 August 2014 | | 464 × 334 (35 KB) | Maintenance script (Talk) | Uploaded by import script |
- You cannot overwrite this file.
File usage
The following page links to this file: