File:Figure 4.28 - Vertical distribution of turbulent diapycnal diffusivity along the rim of the Scotia Sea.png
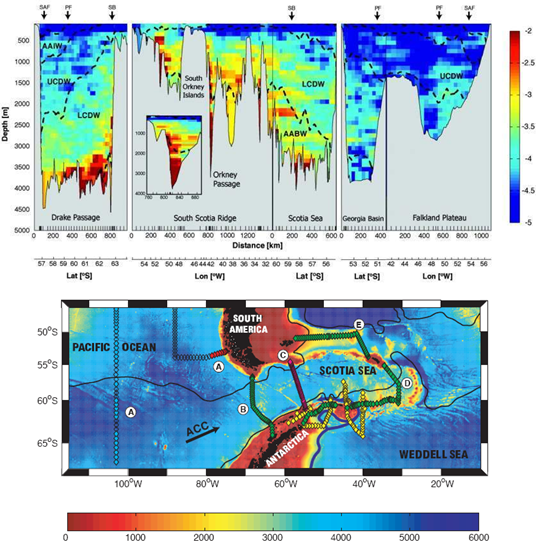
The level of turbulent energy is high over rough bottom topography up to a distance of several hundred kilometres and down into the deep ocean. As an indicator of turbulent mixing the vertical distribution of log10 of the turbulent diapycnal diffusivity (in m2/sec) which can be measured (top), is displayed along a section following the rim of the Scotia Sea anticlockwise (green dots on the bottom graph). Density surfaces separating water masses (AAIW, Antarctic Intermediate Water; UCDW and LCDW, Upper and Lower Circumpolar Deep Water; AABW, Antarctic Bottom Water) are shown by the thick dashed lines. Crossings of the two main frontal jets of the ACC (SAF, Subantarctic Front; PF, Polar Front) and its southern boundary (SB) are marked in the upper axis. Station positions are indicated by tickmarks at the base of the topography. Reproduced from Naveira Garabato et al. (2004[1]).
- ↑ Naveira Garabato, A.C., Polzin, K.L., King, B.A., Heywood, K.J. and Visbeck, M. 2004. Widespread intense turbulent mixing in the Southern Ocean, Science, 303, 210-213.
File history
Click on a date/time to view the file as it appeared at that time.
| Date/Time | Thumbnail | Dimensions | User | Comment | |
|---|---|---|---|---|---|
| current | 15:31, 6 August 2014 | | 536 × 543 (332 KB) | Maintenance script (Talk) | Uploaded by import script |
- You cannot overwrite this file.
File usage
The following page links to this file: