File:Figure 4.24 - Map of repeat section locations and deep potential temperature-salinity curves.png
From ACCE
Revision as of 15:30, 6 August 2014 by Maintenance script (Talk)
No higher resolution available.
Figure_4.24_-_Map_of_repeat_section_locations_and_deep_potential_temperature-salinity_curves.png (554 × 458 pixels, file size: 131 KB, MIME type: image/png)
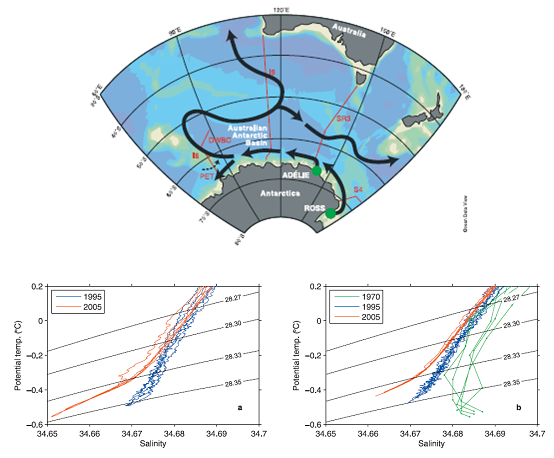
Top) Map indicating location of repeat sections along which changes in bottom water properties have been assessed. The Australian Antarctic Basin is supplied by two sources of Antarctic Bottom Water: the Ross Sea and Adélie Land. Lower) Changes in the deep potential temperature – salinity curves along 115°E, over the continental rise (61-63.3°S, left) and further offshore (56.5 – 61°S, right). From Rintoul (2007[1]).
- ↑ Rintoul, S.R. 2007. Rapid freshening of Antarctic Bottom Water formed in the Indian and Pacific Oceans, Geophys. Res. Lett., 34, L06606, doi:10.1029/2006GL028550.
File history
Click on a date/time to view the file as it appeared at that time.
| Date/Time | Thumbnail | Dimensions | User | Comment | |
|---|---|---|---|---|---|
| current | 15:30, 6 August 2014 | | 554 × 458 (131 KB) | Maintenance script (Talk) | Uploaded by import script |
- You cannot overwrite this file.
File usage
The following page links to this file: