Difference between revisions of "File:Figure 4.24 - Map of repeat section locations and deep potential temperature-salinity curves.png"
From ACCE
(Uploaded by import script) |
(No difference)
|
Latest revision as of 15:30, 6 August 2014
Top) Map indicating location of repeat sections along which changes in bottom water properties have been assessed. The Australian Antarctic Basin is supplied by two sources of Antarctic Bottom Water: the Ross Sea and Adélie Land. Lower) Changes in the deep potential temperature – salinity curves along 115°E, over the continental rise (61-63.3°S, left) and further offshore (56.5 – 61°S, right). From Rintoul (2007[1]).
- ↑ Rintoul, S.R. 2007. Rapid freshening of Antarctic Bottom Water formed in the Indian and Pacific Oceans, Geophys. Res. Lett., 34, L06606, doi:10.1029/2006GL028550.
File history
Click on a date/time to view the file as it appeared at that time.
| Date/Time | Thumbnail | Dimensions | User | Comment | |
|---|---|---|---|---|---|
| current | 15:30, 6 August 2014 | 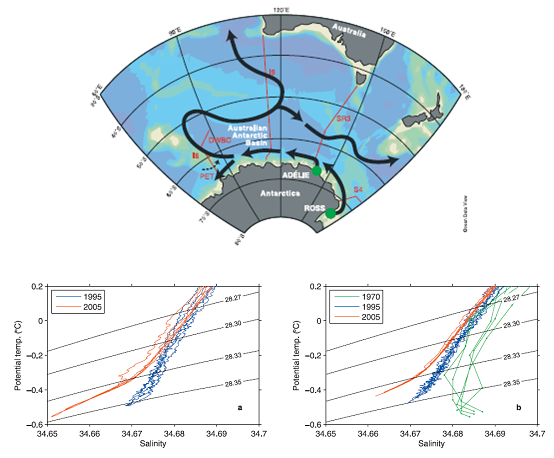 | 554 × 458 (131 KB) | Maintenance script (Talk) | Uploaded by import script |
- You cannot overwrite this file.
File usage
The following page links to this file: