File:Figure 2.25 - Example of active layer spatial variability.png
From ACCE
Revision as of 15:31, 6 August 2014 by Maintenance script (Talk)
No higher resolution available.
Figure_2.25_-_Example_of_active_layer_spatial_variability.png (351 × 750 pixels, file size: 221 KB, MIME type: image/png)
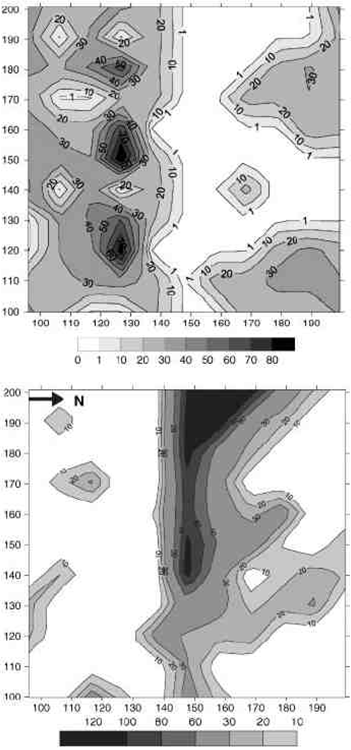
Example of active layer spatial variability. The Boulder Clay CALM grid (100 × 100 m) is located on a flat area close to the Mario Zucchelli Station. Top - active layer thickness (as maximum depth of 0° C isotherm, in cm) on 7 January 2002; lower - snow thickness recorded on the same date. Note the influence of snow accumulation on the active layer thickness distribution. (from Guglielmin, 2006[1]).
- ↑ Guglielmin, M. 2006. Ground surface temperature (GST), active layer, and permafrost monitoring in continental Antarctica. Permafrost and Periglacial Processes, 17, 133-143.
File history
Click on a date/time to view the file as it appeared at that time.
| Date/Time | Thumbnail | Dimensions | User | Comment | |
|---|---|---|---|---|---|
| current | 19:23, 22 August 2014 | | 351 × 750 (221 KB) | Tonyp (Talk | contribs) | Acquired higher resolution image |
| 15:31, 6 August 2014 |  | 468 × 329 (98 KB) | Maintenance script (Talk) | Uploaded by import script |
- You cannot overwrite this file.
File usage
The following page links to this file: