Temperature changes in the instrumental period
- This page is part of the topic Antarctic climate and environment change in the instrumental period
Surface temperature
Surface temperature trends across the Antarctic can be determined using a number of different forms of data, including the in-situ observations, satellite infra-red imagery and ice core isotope measurements. In order to get a reasonable estimate of trends it is necessary to use all these data.
The in-situ observational record of Antarctic surface temperatures is rather sparse and sporadic before the IGY (see Appendix A in King and Turner, (1997[1])), although the Orcadas series from Laurie Island, South Orkney Islands began in 1903 and the Faraday Station/Argentine Islands record began in 1947. However, we are fortunate in having around 16 stations on the Antarctic continent or islands that have reported on a near-continuous basis since the IGY. In addition, a further six stations started reporting during the 1960s, so that we have around two dozen time series that allow the investigation of temperature trends. Unfortunately, the vast majority of the stations are in the Antarctic coastal region or on the islands of the Southern Ocean, with only Vostok and Amundsen-Scott Station being in the interior of the continent.
The in-situ record has been used by several workers to investigate temperature changes across the continent and Southern Ocean (Jacka and Budd, 1991[2]; Jacka and Budd, 1998[3]; Jones, 1995[4]; Raper et al., 1984[5]). Many of the records were scattered across a number of data centres and it was unclear as to the amount of quality control that had been carried out on the observations. SCAR therefore initiated the READER (Reference Antarctic Data for Environmental Research) project to bring as many of the observations together as possible, quality control the data and produce a new data base of monthly mean temperatures (Turner et al., 2004[6]). The READER data base is available online at http://www.antarctica.ac.uk/met/READER/.
The READER data base has now been used in a number of studies concerned with the climate of the Antarctic, including that of Turner et al. (2005a[7]), which considered changes since the start of the routine instrumental record. Here we will use the READER data base and the online meteorological data maintained by Dr. Gareth Marshall (http://www.antarctica.ac.uk/met/gjma/) to examine how Antarctic temperatures have changed over the period of the instrumental record.
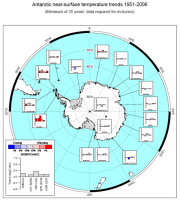
Surface temperature trends from the station data since the early 1950s illustrate a strong dipole of change, with significant warming across the Antarctic Peninsula, but with little change across the rest of the continent (Figure 4.8a). The largest warming trends in the annual mean data are found on the western and northern parts of the Antarctic Peninsula. Here Faraday/Vernadsky Station has experienced the largest statistically significant (<5% level) trend of +0.53 o C/dec for the period 1951-2006. Rothera station, some 300 km to the south of Faraday, has experienced a larger annual warming trend, but the shortness of the record and the large inter-annual variability of the temperatures means that the trend is not statistically significant. Although the region of marked warming extends from the southern part of the western Antarctic Peninsula north to the South Shetland Islands, the rate of warming decreases away from Faraday/Vernadsky, with the long record from Orcadas on Laurie Island, South Orkney Islands only having experienced a warming of +0.20°C/decade. This record covers a 100-year period rather than the 50 years for Faraday. For the period 1951-2000 the temperature trend was +0.13°C/decade.
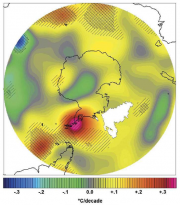
Determining temperature trends across the interior of the Antarctic is difficult as there are only two stations with long records. However, attempts have been made to extrapolate the station trends across the rest of the continent. Chapman and Walsh (2007[8]) produced estimates of annual tends (Figure 4.8b) and found the greatest warming over the Antarctic Peninsula, but with a small warming (~0.1º C/dec) across West Antarctica and much of East Antarctica. However, they also found cooling in a swath from the South Pole to Halley Station.
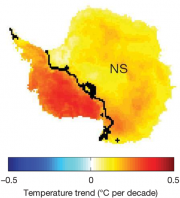
Steig et al. (2009[9]) use statistical climate-field-reconstruction techniques to produce similar fields of trends for the seasons and the year as a whole. The annual trends (Figure 4.8c) show significant warming over most of West Antarctica with trends greater than 0.1º C/dec over the last 50 years. The trends are greatest during the winter and spring.
There has been a great deal of debate about the causes of the recent temperature changes across the continent. The summer warming on the eastern side of the Antarctic Peninsula has been shown to be a result of anthropogenic activity, and particularly the spring time loss of stratospheric ozone (Marshall et al., 2006[10]). For the continent as a whole Gillett et al. (2009[11]) carried out a formal attribution study to determine whether the observed changes were within the range of natural climate variability or whether they were a result of anthropogenic forcing. They found that recent changes were not consistent with internal climate variability or natural climate drivers alone, and were directly attributable to human influence.
Prior to the establishment of the research stations in the middle of the Twentieth Century we are reliant on ice core data to investigate surface temperature changes. Many studies have used single and multiple cores to investigate changes at selected sites or to investigate regional change. However, ‘stacking’ multiple cores can provide insight into Antarctic-wide change. Schneider et al. (2006[12]) stacked several isotope records from ice cores to obtain a continental pattern of temperature over the past 200 years. The ice core stack was found to be well correlated with annual mean temperature and the data suggested warming of 0.2º C since the late nineteenth century. The paper suggested that recent Antarctic cooling is superimposed on longer term warming, with the more recent cooling being attributed to the SAM strengthening.
There is also evidence of climatic changes over the Southern Ocean. In recent decades, instrumental data recorded at the South African Weather Service station on Marion Island (46º 32’ S and 37º 30’ E) shows that the local climate of this island has undergone significant changes since the 1960s, mostly in the austral summer. These include a decrease in rainfall, an increase in non-rainy days, changes in wind speed and direction, and an increase in maximum and minimum local air temperature and in nearshore SST. Research suggests that the changes are linked to the well-documented shift of the semiannual oscillation and SAM after about 1980 (Rouault et al., 2005[13]).
Satellite-derived surface temperatures for the Antarctic have been used to investigate the extent of the region of extreme variability, since this was not possible with the sparse station data. King and Comiso (2003[14]) found that the region in which satellite-derived surface temperatures correlated strongly with west Peninsula station temperatures was largely confined to the seas just west of the Peninsula. It was also found that the correlation of Peninsula surface temperatures with those over the rest of continental Antarctica was poor, confirming that the west Peninsula is in a different climate regime.
The warming on the western side of the Antarctic Peninsula has been largest during the winter season, with the winter temperatures at Faraday increasing by +1.03°C/decade over 1950-2006. In this area there is a high correlation during the winter between the sea ice extent and the surface temperatures, suggesting more sea ice during the 1950s and 1960s and a progressive reduction since that time. King and Harangozo (1998[15]) found a number of ship reports from the Bellingshausen Sea in the 1950s and 1960s when sea ice was well north of the locations found in the period of availability of satellite data, suggesting some periods of greater sea ice extent than found in recent decades. However, there is very limited sea ice extent data before the late 1970s, so we have largely circumstantial evidence of a mid-century sea ice maximum at this time. At the moment it is not known whether the warming on the western side of the Peninsula has occurred because of natural climate variability or as a result of anthropogenic factors.
Temperatures on the eastern side of the Peninsula have risen most during the summer and autumn months, with Esperanza having experienced a summer increase of +0.41°C/decade between 1946-2006. This temperature rise has been linked to a strengthening of the westerlies that has taken place as the SAM has shifted into its positive phase (Marshall et al., 2006[10]). Stronger winds have resulted in more relatively warm, maritime air masses crossing the peninsula and reaching the low-lying ice shelves on the eastern side.
Around the rest of the Antarctic coastal region there have been few statistically significant changes in surface temperature over the instrumental period. The largest warming outside the Peninsula region is at Scott Base, where temperatures have risen at a rate of +0.29°C/decade, although this is not statistically significant. The high spatial variability of the changes is apparent from the data for Novolazarevskya and Syowa, which are 1,000 km apart. The former station has warmed at a rate of +0.25°C/decade between 1962–2000, which is significant at the 10% level, whereas the record from Syowa shows almost no change over this period.
One area of the Antarctic where marked cooling has been noted, at least over a relatively short time period, is the McMurdo Dry Valleys. Here automatic weather station (AWS) data for 1986-2000 shows that there has been a cooling of 0.7°C/decade, with the most pronounced cooling being in the summer (the December-February tend was 1.2°C/decade, statistically significant at the 2% level) and autumn (March-May trend of 2.0°C/decade, statistically significant at close to the 10% level). Winter (June-August) and spring (September-November) show small temperature increases of (0.6°C and 0.1°C/decade, which are not significant) (Doran et al., 2002[16]). Bertler et al. (2004[17]) suggest that this short-term cooling is associated with ENSO-driven changes in atmospheric circulation.
On the interior plateau, Amundsen-Scott Station at the South Pole has shown a small cooling in the annual mean temperature of -0.05º C/dec over 1958-2008, although this trend is not statistically significant. This small cooling is thought to be a result of fewer maritime air masses penetrating into the interior of the continent. The data show a cooling throughout the year, with the largest change being during the summer, however, only the annual change is statistically significant. The other plateau station, Vostok, has not experienced any statistically significant change in temperatures, either in the annual or seasonal data, since the station was established in 1958.
A recent analysis of the in-situ surface meteorological observations (Chapman and Walsh, 2007[8]) gridded the available observations and analysed the trends. For the period 1958-2002 they found a modest warming over much of the 60°–90°S region, although the largest warming trends were over the Antarctic Peninsula. They also identified a zone of cooling stretching from Halley Station to the South Pole. They found overall warming in all seasons, with winter trends being the largest at +0.172°C/decade while summer warming rates were only +0.045°C/decade. For the 45 year period the temperature trend in the annual means was +0.082°C/decade. Interestingly the trends computed were very sensitive to start and end dates, with trends calculated using start dates prior to 1965 showing overall warming, while those using start dates from 1966 to 1982 show net cooling over the region. Because of the large interannual variability of temperatures over the continental Antarctic, most of the continental trends are not statistically significant significant through 2002.
The temperature records from the Antarctic stations suggest that the trends at many locations are dependent on the time period examined, with changes in the major modes of variability affecting the temperature data. Perhaps the largest change in climatic conditions across the high southern latitudes has been the shift in the SAM into its positive phase during austral summer and autumn (see The SAM in the instrumental period). The SAM has changed because of the increase in greenhouse gases and the development of the Antarctic ozone hole, although the loss of stratospheric ozone has been shown to have had the greatest influence during Austral summer (Arblaster and Meehl, 2006[18]). During austral autumn, the causality of the upward SAM trends is not well understood, as stratospheric ozone changes do not appear to play a major role (Fogt et al., In Press). As discussed at many points in this document, the changes in the SAM have influenced many aspects of the Antarctic environment over recent decades.
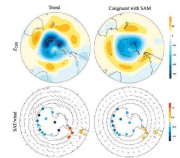
Thompson and Solomon (2002[19]) considered the surface temperature trends over 1969-2000 and showed that the contribution of the SAM was a warming over the Antarctic Peninsula and a cooling along the coast of East Antarctica (Figure 4.9). They only considered the months of December to May, which was when the largest change in the SAM has taken place. They attributed the trends primarily to changes in the polar vortex as a result of the development of the Antarctic ozone hole. While the major loss of stratospheric ozone occurs in the spring, the greatest changes in the tropospheric circulation, such as the strengthening of the westerlies, has been in the summer and autumn. There is therefore a downward propagation of the vortex strengthening, with it starting in the spring in the stratosphere and moving down through the troposphere to the surface through the summer and autumn. As discussed earlier, the warming on the eastern side of the Antarctic Peninsula has been linked to the stronger westerlies associated with the changes in the SAM. However, the large winter-season warming on the western side of the peninsula appears to be largely independent of changes in the SAM.
It is very important to determine the surface temperature trends across the high Antarctic plateau, but as noted earlier, there are only two stations with long temperature records. Since the mid-1980s many AWSs have been deployed in the interior, filling important gaps in the observational network. These can provide valuable indications of temperature trends at remote locations, although few AWS systems have been maintained at the same locations since the 1980s and there can be gaps in the data when systems fail during the winter.
Another means of examining temperature trends is via the infra-red imagery from the polar orbiting satellites. Such imagery can only be used under cloud-free conditions, and provides data on the snow surface rather than at the standard meteorological level of 2 m above the surface, but with such high spatial coverage it provides a very valuable supplement to the in-situ observations. Comiso (2000[20]) used the NOAA AVHRR imagery to investigate the trends in skin temperature across the Antarctic over the period 1979-1998. The satellite-derived temperatures were compared with the in-situ observations from 21 stations and found to be in good agreement with a correlation coefficient of 0.98. The trends showed a cooling across much of the high plateau of East Antarctica and across Marie Byrd Land (-0.1 to -0.2º C/yr), with the former being consistent with the trends derived by Thompson and Solomon (2002[19]), although the Comiso trends are for annual data and the Thompson and Solomon study is concerned only with the summer and autumn.
In recent decades many relatively short ice cores have been drilled across Antarctica by initiatives such as the International Trans Antarctic Science Expedition (ITASE) (Mayewski et al, 2006[21]). These provide data over roughly the last 200 years and therefore provide a good overlap with the instrumental data. Large-scale calibrations have been carried out between satellite-derived surface temperature and ITASE ice core proxies (Schneider et al., 2006[12]). Their reconstruction of Antarctic mean surface temperatures over the past two centuries was based on water stable isotope records from high-resolution, precisely dated ice cores. The reconstructed temperatures indicated large interannual to decadal scale variability, with the dominant pattern being anti-phase anomalies between the main Antarctic continent and the Antarctic Peninsula region, which is the classic signature of the SAM. The reconstruction suggested that Antarctic temperatures had increased by about 0.2º C since the late nineteenth century. They found that the SAM was a major factor in modulating the variability and the long-term trends in the atmospheric circulation of the Antarctic.
Upper air temperature changes
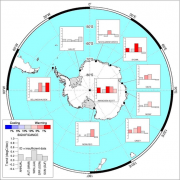
Analysis of Antarctic radiosonde temperature profiles indicates that there has been a warming of the troposphere and cooling of the stratosphere over the last 30 years. This is the pattern of change that would be expected from increasing greenhouse gases, however, the mid-tropospheric warming in winter is the largest on Earth at this level. The data show that regional mid-tropospheric temperatures have increased most around the 500 hPa level with statistically significant changes of 0.5 – 0.7ºC/decade (Figure 4.10) (Turner et al., 2006[22]). Figure 4.10 indicates warming at many of the radiosonde stations around the continent, but a clear pattern of winter warming is apparent around the coast of East Antarctica and at the pole.
The warming is represented in the ECMWF 40 year reanalysis, which is not surprising since the radiosonde ascents were assimilated into the system. In fact the warming trends are slightly larger than when computed from the radiosonde data, since there is a known slight cold bias in the early part of the reanalysis data set.
The exact reason for such a large mid-tropospheric warming is not known at present. However, it has recently been suggested that it may, at least in part, be a result of greater amounts of polar stratospheric cloud (PSC) during the winter (Lachlan-Cope et al., In press). PSCs are a feature of the cold Antarctic winter, forming at temperatures below about -78º C. However, the Antarctic stratosphere has cooled in recent decades because the greenhouse gas ozone is now missing from the lower stratosphere in spring, and the greenhouse gas carbon dioxide is concentrated in the troposphere and leads to further cooling of the stratosphere. Analysis of stratospheric temperatures in the reanalysis data sets suggest that over the last 30 years the area where PSCs might form in winter has increased in size, so promoting the formation of more PSCs. Once present, PSCs act like any other cloud, giving a warming below their level and cooling above. We have little data on the optical properties of PSCs, but modelling suggests that if the optical depth in the infrared is around 0.5 then a greater amount of PSCs could give a mid-tropospheric warming.
PSCs are not currently represented explicitly in climate models, but if further research shows that they are responsible for the large winter season mid-tropospheric warming they need to be represented more realistically in the models.
Attribution of change
Great advances have been made in our understanding of recent temperature changes across the Antarctic in the last few years. We now know that anthropogenic activity, and particularly the presence of the Antarctic ozone hole, has played a large part in the near-surface warming on the eastern side of the Antarctic Peninsula, and a formal attribution study (Gillett et al., 2009[11]) found that that recent changes were not consistent with internal climate variability. However, we still do not know the reasons for the large winter season warming on the western side, although it is thought to be linked to a reduction in sea ice extent since the 1950s.
The recently discovered large mid-tropospheric warming above the continent in winter is not fully understood at present. If increasing amounts of PSCs are shown to be responsible this will be an interesting Antarctic amplification of the effect of greenhouse gas increases, along with being a side effect of the ozone hole. However, more research is needed to confirm this.
References
- ↑ King, J.C. and Turner, J. 1997. Antarctic meteorology and climatology, Cambridge University Press, Cambridge, UK, 409 pp.
- ↑ Jacka, T.H. and Budd, W.F. 1991. Detection of temperature and sea ice extent changes in the Antarctic and Southern Ocean. Weller, G., Wilson, C. L., and Severin, B. A. Proceedings of the International Conference on the Role of the Polar Regions in Global Change. June 11-15, 1990, University of Alaska Fairbanks, 63-70. Fairbanks, AK, University of Alaska, Geophysical Institute.
- ↑ Jacka, T.H. and Budd, W.F. 1998. Detection of temperature and sea-ice-extent changes in the Antarctic and Southern Ocean, 1949-96, Annals of Glaciology, 27, 553-559.
- ↑ Jones, P.D. 1995. Recent variations in mean temperature and the diurnal temperature range in the Antarctic, Geophysics Research Letters, 22 [11], 1345-1348.
- ↑ Raper, S.C., Wigley, T.M., Jones, P.D. and Salinger, M. J. 1984. Variations in surface air temperatures: Part 3. The Antarctic, 1957-1982, Monthly Weather Review, 112, 1341-1353.
- ↑ Turner, J., Colwell, S. R., Marshall, G. J., Lachlan-Cope, T. A., Carleton, A. M., Jones, P. D., Lagun, V., Reid, P. A. and Iagovkina, S. 2004. The SCAR READER project: Towards a high-quality database of mean Antarctic meteorological observations, Journal of Climate, 17, 2890-2898.
- ↑ Turner, J., Colwell, S.R., Marshall, G.J., Lachlan-Cope, T.A., Carleton, A.M., Jones, P.D., Lagun, V., Reid, P.A. and Iagovkina, S. 2005a. Antarctic climate change during the last 50 years, International Journal of Climatology, 25, 279-294.
- ↑ 8.0 8.1 8.2 Chapman, W.L. and Walsh, J. E. 2007. A Synthesis of Antarctic Temperatures, Journal of Climate, 20, 4096-4117.
- ↑ 9.0 9.1 Steig, E.J., Schneider, D.P., Rutherford, S.D., Mann, M.E., Comiso, J. C. and Shindell, D.T. 2009. Warming of the Antarctic ice-sheet surface since the 1957 International Geophysical Year, Nature, 457, 459-462.
- ↑ 10.0 10.1 Marshall, G. J., Orr, A., Van Lipzig, N.P.M. and King, J.C. 2006. The impact of a changing Southern Hemisphere Annular Mode on Antarctic Peninsula summer temperatures, Journal of Climate, 19 [20], 5388-5404.
- ↑ 11.0 11.1 Gillett, N.P., Stone, D.A., Stott, P.A., Nozawa, T., Karpechko, A.Y., Hegerl, G.C., Wehner, M.F. and Jones, P.D. 2009. Attribution of polar warming to human influence, Nature Geoscience, 1, 760-764.
- ↑ 12.0 12.1 Schneider, D.P., Steig, E.J., Van Ommen, T.D., Dixon, D.A., Mayewski, P.A., Jones, J.M. and Bitz, C.M. 2006. Antarctic temperatures over the past two centuries from ice cores, Geophysics Research Letters, 33, L16707, doi:10.1029/2006GL027057.
- ↑ Rouault, M., Melice, J.L., Reason, C.J.C. and Lutjeharms, J.R.E. 2005. Climate variability at Marion Island, Southern Ocean, since 1960, J. Geophy. Res. – Oceans, 110, C05007, doi:10.1029/2004JC002492.
- ↑ King, J.C. and Comiso, J.C. 2003. The spatial coherence of interannual temperature variations in the Antarctic Peninsula, Geophysics Research Letters, 30, [2 10.1029/2002GL015580].
- ↑ King, J.C. and Harangozo, S.A. 1998. Climate change in the western Antarctic Peninsula since 1945: observations and possible causes, Annals of Glaciology, 27, 571-575.
- ↑ Doran, P.T., Priscu, J.C., Lyons, W.B., Walsh, J.E., Fountain, A.G., McKnight, D.M., Moorhead, D.L., Virginia, R.A., Wall, D.H., Clow, G.D., Fritsen, C.H., McKay, C.P. and Parsons, A.N. 2002. Antarctic climate cooling and terrestrial ecosystem response, Nature, 415, 517-520.
- ↑ Bertler, N.A.N., Barrett, P.J., Mayewski, P.A., Fogt, R.L., Kreutz, K.J. and Shulmeister, J. 2004. El Niño suppresses Antarctic warming, Geophys. Res. Lett., 31, L15207, doi:10.1029/2004GL020749.
- ↑ Arblaster, J.M. and Meehl G.A. 2006. Contributions of external forcings to Southern Annual Mode trends, Journal of Climate, 19, 2896-2905.
- ↑ 19.0 19.1 19.2 Thompson, D. and Solomon, S. 2002. Interpretation of recent southern hemisphere climate change, Science, 296(5569), 895-899.
- ↑ Comiso, J.C. 2000. Variability and trends in Antarctic surface temperatures from in situ and satellite infrared measurements, Journal of Climate, 13, 1674-1696.
- ↑ Mayewski, P.A. Et AL. 2006. The International Trans-Antarctic Scientific Expedition (ITASE): An overview, Annals of Glaciology, 41, 180-185.
- ↑ 22.0 22.1 Turner, J., Lachlan-Cope, T.A., Colwell, S.R., Marshall, G.J. and Connolley, W.M. 2006. Significant warming of the Antarctic winter troposphere, Science, 311, 1914-1917.
