Temperature changes over the 21st century
- This page is part of the topic Atmospheric change over the next 100 years
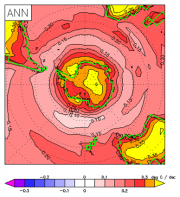
A significant surface warming over Antarctica is projected over the Twenty First Century. The weighted average of the A1B scenario runs of the CMIP3 models shows an increase of the annual average surface temperature of 0.34°C/decade over land and grounded ice sheets (Bracegirdle et al., 2008[1]) (Figure 5.6). All the CMIP3 models show a warming, but with a large range from 0.14 to 0.5°C/decade under the A1B scenario. The difference between the ensemble average projections of each scenario is smaller than the inter-model spread for any given scenario.
Due to the retreat of the sea ice edge induced by global warming, the largest projected surface warming occurs during the winter when the sea ice extent approaches its maximum, e.g. 0.51 ± 0.26 C/decade off East Antarctica (Bracegirdle et al., 2008[1]).
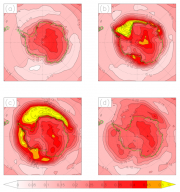
Inland, away from coastal regions there is very little seasonal dependence of the warming trend, which in all seasons is largest over the high-altitude interior of East Antarctica according to the model average (Figure 5.7). Despite this large increase of temperature, the surface temperature by the year 2100 will remain below freezing over most of Antarctica and therefore will not contribute significantly to melting.
The pattern of warming for the next 100 years is different between simulations and observations of temperature change for the latter part of the Twentieth Century. The most notable difference is that the observed and simulated maximum of warming over the Antarctic Peninsula for the latter part of the Twentieth Century is not present in projections of change over the Twenty First Century. That is because although the Peninsula does continue to warm, other parts of Antarctica warm with it.
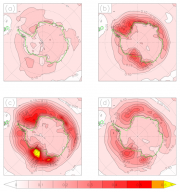
The model consensus for warming is strong for Antarctica as a whole, but there is large uncertainty in the regional detail. One way to measure the significance of a projected change is to calculate a signal to noise ratio of that change. Here the signal is the ensemble average change and the noise is the standard deviation of the inter-model spread. A change can be thought of as ‘significant’ if larger than the inter-model standard deviation, i.e. a signal to noise ratio of greater than one. In Figure 5.8 it can be seen that at most grid points the projected increases of temperature are larger than the inter-model standard deviation. In particular over the Antarctic continent the projected warming shown in Figure 5.7 is much larger than the inter-model spread (Figure 5.8). This demonstrates strong confidence that there will be a warming at the surface in these regions under the A1B scenario. There is less confidence in the large warming trends around the coast than in the smaller changes over the high interior. This is due to the large uncertainty over the sea ice and ocean projections.
According to the IPCC report the warming over the Antarctic continent is 0.5-1.0ºC less than over most other landmasses around the globe (apart from south-east Asia and southern South America where increases are the same). The reasons for this are not known. Over the Southern Ocean projected surface warming is much smaller than the global average due to the large heat uptake by the ocean.
In the mid-troposphere above the continent, the annual ensemble mean warming rate at 500 hPa of 0.28ºC/decade is slightly smaller than the surface warming, with no evidence of the mid-tropospheric maximum that has been observed over the last 30 years (Turner et al., 2006[2]). The mid-tropospheric warming at low latitudes is larger than over and around Antarctica, which increases the baroclinicity and seems to contribute to the southward migration of the storm tracks that is simulated by the CMIP3 models (Yin, 2005[3]).
Extremes
Very little work has been done on changes to extremes over Antarctica. Temperature-related extreme indices are available from the CMIP3 archive and have been assessed by Tebaldi et al. (2006[4]). The heat wave duration index (defined as the maximum period greater than five consecutive days with the daily maximum temperature greater than 5ºC above the 1961-1990 mean daily maximum temperature) shows significant increases along coastal Antarctica, where melting can occur, but largest increases over the interior, where heat waves are not warm enough to cause melting. On even shorter timescales, the magnitude, timing and frequency of extreme events (e.g. temperature minima/maxima, freeze-thaw events) can be of considerable relevance to predictions of future trajectories in terrestrial ecosystems.
The extreme temperature range between the coldest and warmest temperature of a given year is projected to decrease around coastal Antarctica and show little change over most of the interior of the continent. Further assessment is required to determine the reasons for the projected pattern of changes. One possibility is that the models simulate a larger nighttime than daytime warming. This has been observed during the second half of the Twentieth Century over the Antarctic Peninsula (Hughes et al., 2007[5]).
References
- ↑ 1.0 1.1 Bracegirdle, T.J., Connolley, W.M. and Turner, J. 2008. Antarctic climate change over the Twenty First Century, Journal of Geophysical Research – Atmospheres, 113, D03103, doi:03110.01029/02007JD008933.
- ↑ Turner, J., Lachlan-Cope, T.A., Colwell, S.R., Marshall, G.J. and Connolley, W.M. 2006. Significant warming of the Antarctic winter troposphere, Science, 311, 1914-1917.
- ↑ Yin, J. H. 2005. A consistent poleward shift of the storm tracks in simulations of 21st century climate, Geophysical Research Letters, 32, L18701.
- ↑ Tebaldi, C., Hayhoe, K., Arblaster, J.M. and Meehl, G.A. 2006. going to the extremes: An intercomparison of model-simulated historicak and future changes in extreme events, Climate Change, 79, 185-211.
- ↑ Hughes, G.L., Rao, S.S. and Rao, T.S. 2007. Statistical analysis and time-series models for minimum/maximum temperatures in the Antarctic Peninsula, Proceedings of the Royal Society A, 463, 241-259.


