Antarctic sea ice cover in the instrumental period
- This page is part of the topic Antarctic climate and environment change in the instrumental period
Contents
Introduction
This section considers the variability and trend in Antarctic sea ice area and extent over the last century. This time splits into two very distinct periods. Since the 1970s microwave instruments on polar orbiting satellites have enabled sea ice observations to be made year-round and even during periods of complete cloud cover. Before that time, data were reliant on sparse ship observations that were mainly collected during the summer months.
Sea ice cover in the pre-satellite era
Detailed maps of the distribution of the sea ice cover at a good temporal resolution could not be made before the advent of the satellite era, because of the vast extent of sea ice in the region, general inaccessibility and adverse weather conditions. Observations of the sea ice cover were confined mainly to ship observations, such as those compiled by MacKintosh and Herdman (1940[1]). During the whaling period, the ships (which were not icebreakers) were normally located at or near the ice edge, the location of which was not precisely defined or consistently identified. The ice edge as defined using satellite passive microwave data is usually taken as the 15% ice concentration contour, and it is not known how well this would match the ice edge as observed by ships (Worby and Comiso, 2004[2]). The whaling data were used by de la Mare (1997[3]) to infer that the ice cover in the 1950s and 1960s was significantly more extensive than that seen in more recent times as revealed by satellite data.
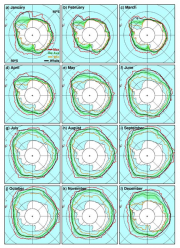
A more direct comparison of the satellite monthly climatology for the period 1978 to 2007 with the MacKintosh monthly data set, as digitized from the original maps by Wadhams (personal communication, 2001), is presented in Figure 4.29. Assuming that the earlier ship observations provide a reasonably accurate representation of average ice edge locations, then the average locations of the ice edge during the satellite period were usually further south, showing that ice cover was more extensive in the 1950s and 1960s than later. These results are consistent with the observation that Antarctica has warmed during the same period (Steig et al., 2009[4]). Interpretation of these results, however, has to be done in the context of the uncertainties as pointed out by Ackley et al. (2003[5]).
Simulations with the climate model LOVECLIM with simple data assimilation provides information on sea ice area during the Twentieth Century. It shows a decrease of 0.5 × 10⁶ km2 from the 1960s to the early 1980s, but a slight increase from 1980 to 2000 (Goosse et al, 2009[6]). Although we lack the sea ice data to confirm the early decrease, the model is consistent with available data from both atmosphere and ocean.
Variability and trends in sea ice using satellite data
The ESMR instrument flown on board the Nimbus-5 satellite was the first scanning microwave radiometer and therefore was first to provide the true spatial distribution of the ice cover at a reasonable time resolution. Although meant primarily for rainfall studies it found its best applications for sea ice studies because of the high contrast in the emissivity of sea ice and liquid water. While the data from this instrument are not used in the time series analysis presented below, the sea ice cover during this period was well documented (Zwally et al., 1983[7]). The data led to the discovery of the existence of the large Weddell polynya about the size of California that persisted throughout winter and for three successive years from 1974 through 1976 (Zwally and Gloersen 1977[8]). As discussed in Chapter 2, combining ESMR data with SMMR and SSM/I observations is difficult because (i) there is no overlap in data to ensure that the ESMR data provides the same ice edge and ice extent as in the other data sets; (ii) there are too many gaps including more than 3 months in succession in 1975; (iii) and inaccurate ice concentrations were recorded because of only one channel being available for the sensor, making it impossible to correct for spatial variations in emissivity and temperature. Qualitative analysis can be done: for example, a four-year average of the ESMR data can be compared with four-year averages of SMMR and SSM/I data during different periods, but, unless large changes are apparent, the comparison may be difficult to interpret. The following discussion concentrates on the period from 1978 when the SMMR data became available.
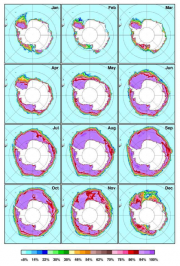
The large-scale seasonal variation of the sea ice cover in the Southern Hemisphere is depicted by the colour-coded multiyear monthly averages of the ice cover (Figure 4.30). The AMSR-E ice concentration data are gridded at 12.5 km to provide a more accurate spatial representation of the sea ice cover than the SMMR and SSM/I data, which are gridded at 25 km resolution. The maps were derived by taking the average of all data available for each month, using the dataset that starts in June 2002 and ends in December 2007. The monthly data set thus represents contemporary ice cover and could serve as a guideline for expected distribution of the Antarctic sea ice cover. The series of images starts in January, usually the warmest mid-summer month and the time of highest melt rate. The minimum extent usually occurs in late February or early March. There are two primary locations where ice survives in the summer: one in the Western Weddell Sea and the other in the Bellingshausen, Amundsen, and Ross Seas. The extents of the perennial ice in these two regions are comparable, but vary slightly in magnitude and location from one year to another. The period of most rapid growth is from April to June; by July it has reached close to its maximum extent, which is normally in September or October. Ice cover decays rapidly between November and January. Around the continent, sea ice advances the least from the coastline mainly in the Western Pacific (90°E to 150°E) and at the tip of the Antarctic Peninsula, where the coast is farthest to the north. The shape of the ice cover during ice maxima (September) is almost symmetrical around the continent, with a tendency to have a sharp corner at about 217°E, which is in part influenced by the shape of the bathymetry there.
Among the most distinctive features in the inner zone of the ice cover are the reduced ice concentrations (i) adjacent to the Ross Ice Shelf, (ii) at or near the Maud Rise (5ºE), and (iii) near the Cosmonaut Sea (45ºE). These are regions where short term (or transient) polynyas usually occur in mid-winter (Comiso and Gordon, 1996[9]), and which have been associated with the initiation of deep ocean convection and the formation of the high salinity bottom water that drives the global thermohaline circulation. Because they normally appear during different times of the winter season and in different places they are not well represented in the winter climatological averages. The features are most evident in the images in late winter to spring (September to November) suggesting that the ice cover in these regions is vulnerable to divergence and melt because of relatively thinner ice and warmer water under the ice. Such regions have also been the scene of high productivity (Smith and Comiso, 2008[10]) reflecting the possible influence of sea ice, as has been suggested previously (Smith and Nelson, 1986[11]).
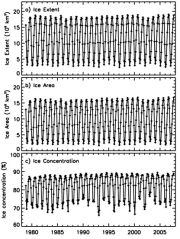
The parameters that have been used for quantifying the variability and trends in the sea ice cover are ice extent and ice area, both of which are derived from the passive microwave ice concentration data. Ice extent is defined as the integrated sum of the area of all the pixel elements with at least 15% concentration, while ice area is the integrated sum of the area of each pixel multiplied by the ice concentration. Time series plots of monthly values of the ice area, ice extent and also average ice concentration as derived from SMMR and SSM/I data from November 1978 to December 2007 are presented in Figure 4.31. Over the 28-year period of consistently processed passive microwave data, the seasonal and yearly variations in the sea ice extent and ice areas appear to be very similar. The annual maxima and minima vary only slightly despite relatively large interannual variations in average ice concentrations, especially during the summer period. In the summer, the large fluctuation may be caused by the vulnerability of the ice cover to divergence due to winds, waves and other forcings, because of relatively smaller extents. For example, more ice could be advected further north where the water is warmer during some years when southerly winds are prominent. The average ice concentration is almost constant in the winter, at about 83%, while the average ice concentration in the summer ranges from 59% to 69%. The distributions of ice extents vary consistently with the ice area, with the latter being somewhat lower, as expected.
During the years when the monthly ice extent and area in the winter were most expansive (1980) or least expansive (1986), the corresponding values in the subsequent summer were not the most expansive or least expansive, respectively. Thus the decay patterns are not significantly influenced by the extent of ice during the preceding winter period. Conversely, the growth patterns are also not significantly influenced by the extent of ice during the preceding summer. This counter-intuitive phenomenon is more apparent on a regional basis. For example, in the Weddell Sea, anomalously extensive ice cover in winter is usually followed by anomalously low ice cover area in the summer and vice-versa (Zwally et al., 1983[7]).
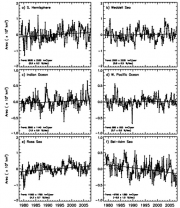
To assess interannual changes and trends in the sea ice extent and ice area, monthly anomalies are used, as in previous studies (e.g., Zwally et al., 2002a[12]). The monthly anomalies were estimated by subtracting monthly climatologies from each month from November 1978 to December 2007. The monthly climatologies were generated by taking the average of all satellite data available for each of the months. For consistency only SMMR and SSM/I data during the period were used. The sea ice extent shows a positive trend of 0.9 ± 0.2% per decade for the Southern Hemisphere for the period January 1979 to December 2008. This is consistent with the 1.0 ± 0.4% per decade reported by Zwally et al. (2002a[12]) for the 1979 to 1998 period. The trend in ice area is slightly more positive at 1.6 ± 0.2%/decade, in part because of a positive trend in ice concentration at about 0.93 ± 0.13%/decade. The errors cited are the statistical error as provided by the standard deviation of the slopes in the regression analysis. Unknown biases that may be associated with different calibration and resolution of the SMMR and SSM/I sensors are not reflected by this error. Assuming that the latter is small, as inferred from the overlap of SMMR and SSM/I data of about a month, the positive trend is small but significant. This is consistent with observed cooling in parts of the Antarctic during the period (Comiso, 2000[13]; Kwok and Comiso, 2002[14]).
Trend analysis of the ice extent in different Antarctic sectors (as defined in Zwally et al., 2002a[12]) (see Figure 4.32) yields positive trends of varying magnitude in all except in the Bellingshausen/Amundsen Seas sector. The trend is least positive in the Western Pacific and the Weddell Sea sector at 0.7 ± 0.6 and 0.8 ± 0.5%/decade followed by the Indian Oceans sectors at 1.9 ± 0.6%/decade. The most positive is the Ross Sea sector at 4.3 ± 0.7%/decade; an increase that was simulated by the LOVECLIM model (Goosse et al., 2009[6]). The trend in the Bellingshausen/Amundsen Seas sector is -6.8 ± 1.0%/decade, which serves to balance the relatively high trend in the Ross Sea. Since these two sectors are adjacent to one another, the opposite trends in the two sectors are in part caused by the advection of ice from one sector to the other. This pattern of change has been linked to the recent deepening of the Amundsen Sea Low as a result, primarily, of the loss of stratospheric ozone (Turner et al., 2009[15]).
The Antarctic Peninsula adjacent to the Bellingshausen/Amundsen Seas sector is an area of marked warming, as described previously by King (1994[16]) and Jacobs and Comiso (1997[17]). Also, the variability of ice in the Ross Sea region is associated with the influence of ENSO (Ledley and Huang, 1997[18]) and the continental area adjacent to it has been experiencing some cooling during the last two decades (Comiso, 2000[13]; Doran et al., 2002[19]). The positive trend in the Ross Sea, which is the site of a major coastal polynya, suggests increased ice production and a more important role of the region in bottom water formation.
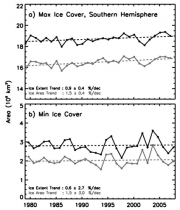
Yearly maximum and minimum ice extent and ice area were estimated for each year using 5 day running averages of daily data and the results are presented in Figure 4.33. While interannual changes in wind circulation can be a significant factor, these parameters are basically associated with the thermal state of the ice-covered ocean and adjacent seas. The plots for maximum extents and areas are shown to be basically stable with very little interannual variability. Relatively high ice extents occurred in 1980, 1998, 2000, 2005 and 2006 while relatively low values occurred in 1986 and 2002. The high and low values in the ice area maxima are relatively the same but the variability varies slightly because of interannual changes in sea ice concentration. The interannual fluctuations in the ice minimum are much higher with relatively high values in ice extents occurring in 1982, 1983, 1986, 1987, 1994, 1995, 2001 and 2003 while relatively low values occurred in 1993, 1997, and 2006. The interannual changes in ice area minima are similar but there are significant differences, such as the changes from 1982 to 1983 and from 1986 to 1987 where the ice extent shows an increase from one year to the next while the ice area shows a decrease. Such a phenomenon is likely caused by divergences associated with wind conditions that can cause an increase in ice extent but not in ice area. Trend analysis of the data yielded results very similar to those of the overall trend, with the trends of maximum ice values being 0.9 ± 0.4%/decade and 1.5 ± 0.4%/decade for ice extent and ice area, respectively. The trends of minimum ice values are 0.6 ± 2.7 and 1.5 ± 3.0%/decade for ice extent and ice area, respectively. These results show that the trends of maximum ice extents and areas are similar to the corresponding minimum ice extents and areas but with higher statistical variability for the latter.
References
- ↑ Mackintosh, N.A. and Herdman, H.F.P. 1940. Distribution of the pack-ice in the Southern Ocean, Discovery Reports, 19, 285-296.
- ↑ Worby, A.P. and Comiso, J.C. 2004. Studies of the Antarctic sea ice edge and ice extent from satellite and ship observations, Remote Sensing of Environment, 92, 98-111; [Ref: 11519]; AAS Project 189.
- ↑ De La Mare, W.K. 1997. Abrupt mid-twentieth century decline in Antarctic sea-ice extent from whaling records, Nature, 389 (6646), 57-61.
- ↑ Steig, E.J., Schneider, D.P., Rutherford, S.D., Mann, M.E., Comiso, J. C. and Shindell, D.T. 2009. Warming of the Antarctic ice-sheet surface since the 1957 International Geophysical Year, Nature, 457, 459-462.
- ↑ Ackley, S., Wadhams, P., Comiso, J.C. and Worby, A.P. 2003. Decadal decrease of Antarctic sea ice extent inferred from whaling records revisited on the basis of historical and modern sea ice records, Polar Res., 22(1), 19-25.
- ↑ 6.0 6.1 Goosse, H., Lefebvre, W., De Montety, A., Crespin, E. and Orsi, A. 2009. Consistent past half-century trends in the atmosphere, the sea ice and the ocean at high southern latitudes, Climate Dynamics, DOI 10.1007/s00382-008-0500-9.
- ↑ 7.0 7.1 Zwally, H.J., Parkinson, C.L. and Comiso, J.C. 1983. Variability of Antarctic Sea Ice: and Changes in Carbon Dioxide, Science 3 June 1983, 220. no. 4601, 1005-1012.
- ↑ Zwally, H.J. and Gloersen, P. 1977. Passive-microwave images of the polar regions and research applications, Polar Records, 18, 431-450.
- ↑ Comiso, J.C. and Gordon, A.L. 1996. Cosmonaut polynya in the Southern Ocean: Structure and variability, Journal of Geophysical Research-Oceans, 101, Issue C8, 18297-18313.
- ↑ Smith, W.O. and Comiso, J.C. 2008. Influence of sea ice on primary production in the Southern Ocean: A satellite perspective, J. Geophys. Res., 113, C05S93, doi:10.1029/2007JC004251 .
- ↑ Smith, W.O. and Nelson, D.M. 1986. Importance of ice edge phytoplankton production in the Southern Ocean, BioScience, 36, 251-257.
- ↑ 12.0 12.1 12.2 Zwally, H.J, Comiso, J.C., Parkinson, C.L., Cavalieri, D.J. and Gloersen, P. 2002a. Variability of Antarctic sea ice 1979-1998, Journal of Geophysical Research, 10, 3041, doi: 3010.1029/2000JC000733.
- ↑ 13.0 13.1 Comiso, J.C. 2000. Variability and trends in Antarctic surface temperatures from in situ and satellite infrared measurements, Journal of Climate, 13, 1674-1696.
- ↑ Kwok, R. and Comiso, J.C. 2002. Southern ocean climate and sea ice anomalies associated with the Southern Oscillation, J. Climate, 15, 487-501.
- ↑ Turner, J., Comiso, J.C., Marshall, G.J., Lachlan‐Cope, T.A., Bracegirdle, T., Maksym, T., Meredith, M.P., Wang, Z. and Orr, A. 2009. Non‐annular atmospheric circulation change induced by stratospheric ozone depletion and its role in the recent increase of Antarctic sea ice extent, Geophys. Res. Lett., 36, L08502, doi:10.1029/2009GL037524.
- ↑ King, J.C. 1994. Recent variability in the Antarctic Peninsula, International Journal of Climatology, 14(4), 357-369.
- ↑ Jacobs, S.S. and Comiso, J.C. 1997. Climate variability in the Amundsen and Bellingshausen Seas, Journal of Climate, 10(4), 697-709.
- ↑ Ledley, T.S. and Huang, Z. 1997. A Possible ENSO Signal in the Ross Sea, Geophysical Research Letters, 24, 3253-3256.
- ↑ Doran, P.T., Priscu, J.C., Lyons, W.B., Walsh, J.E., Fountain, A.G., McKnight, D.M., Moorhead, D.L., Virginia, R.A., Wall, D.H., Clow, G.D., Fritsen, C.H., McKay, C.P. and Parsons, A.N. 2002. Antarctic climate cooling and terrestrial ecosystem response, Nature, 415, 517-520.
