File:Figure 5.5 - Mean regression of the leading EOF of ensemble mean SH sea level pressure.png
From ACCE
No higher resolution available.
Figure_5.5_-_Mean_regression_of_the_leading_EOF_of_ensemble_mean_SH_sea_level_pressure.png (542 × 244 pixels, file size: 146 KB, MIME type: image/png)
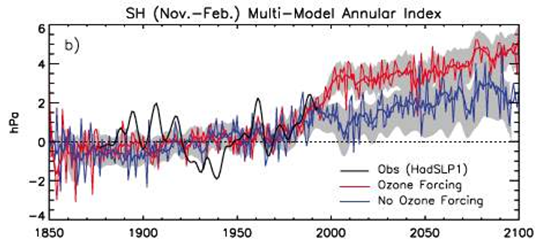
Multi-model mean of the regression of the leading EOF of ensemble mean Southern Hemisphere sea level pressure. The time series of regression coefficients has zero mean between year 1900 and 1970. The thick red line is a 10-year low-pass filtered version of the mean with ozone forcing; the blue line is without ozone forcing. The grey shading represents the inter-model spread at the 95% confidence level and is filtered. A filtered version of the observed SLP from the Hadley Centre (HadSLP1) is shown in black. Adapted from (Miller et al., 2006[1]). From IPCC (2007[2]).
- ↑ Miller, R.L., Schmidt, G.A. and Shindell, D.T. 2006. Forced annular variations in the 20th century Intergovernmental Panel on Climate Change Fourth Assessment Report models, J. Geophys. Res., 111, doi:10.1029/2005JD006323.
- ↑ IPCC 2007. Climate Change 2007: The Physical Science Basis. Contribution of the Intergovernmental Panel on Climate Change. Cambridge University Press, Cambridge.
File history
Click on a date/time to view the file as it appeared at that time.
| Date/Time | Thumbnail | Dimensions | User | Comment | |
|---|---|---|---|---|---|
| current | 15:31, 6 August 2014 | | 542 × 244 (146 KB) | Maintenance script (Talk) | Uploaded by import script |
- You cannot overwrite this file.
File usage
The following page links to this file: