File:Figure 5.4 - Change in average tropical Pacific SSTs and El Nino variability simulated by AOGCMs.png
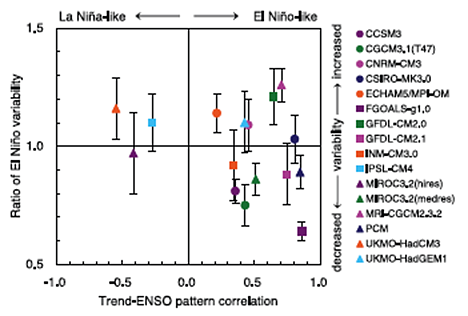
Base state change in average tropical Pacific SSTs and change in El Niño variability simulated by AOGCMs. The base state change (horizontal axis) is denoted by the spatial anomaly pattern correlation coefficient between the linear trend of SST in the 1%/yr CO2 increase climate change experiment and the first Empirical Orthogonal Function (EOF) of SST in the control experiment over the area 10ºS to 10ºN, 120ºE to 80ºW (reproduced from Yamaguchi and Noda, 2006[1]). The change in El Niño variability (vertical axis) is denoted by the ratio of the standard deviation of the first EOF of sea level pressure (SLP) between the current climate and the last 50 years of the IPCC A2 experiments (2051–2100), in the region 30ºS to 30ºN, 30ºE to 60ºW (reproduced from van Oldenborgh et al., 2005[2]). Error bars indicate the 95% confidence interval; from IPCC (2007[3]).
- ↑ Yamaguchi, K. and Noda, A. 2006. Global Warming Patterns over the North Pacific: ENSO versus AO, J. Meteor. Soc. Japan, 84, 221-241.
- ↑ Van Oldenborgh, G.J., Philip, S.Y. and Collins, M. 2005. El Nino in a changing climate: a multi-model study, Ocean Sci., 1, 81-95.
- ↑ IPCC 2007. Climate Change 2007: The Physical Science Basis. Contribution of the Intergovernmental Panel on Climate Change. Cambridge University Press, Cambridge.
File history
Click on a date/time to view the file as it appeared at that time.
| Date/Time | Thumbnail | Dimensions | User | Comment | |
|---|---|---|---|---|---|
| current | 15:30, 6 August 2014 | | 468 × 316 (70 KB) | Maintenance script (Talk) | Uploaded by import script |
- You cannot overwrite this file.
File usage
The following page links to this file: