File:Figure 5.16 - Twenty First Century sea ice seasonal concentration change.png
From ACCE
No higher resolution available.
Figure_5.16_-_Twenty_First_Century_sea_ice_seasonal_concentration_change.png (554 × 593 pixels, file size: 171 KB, MIME type: image/png)
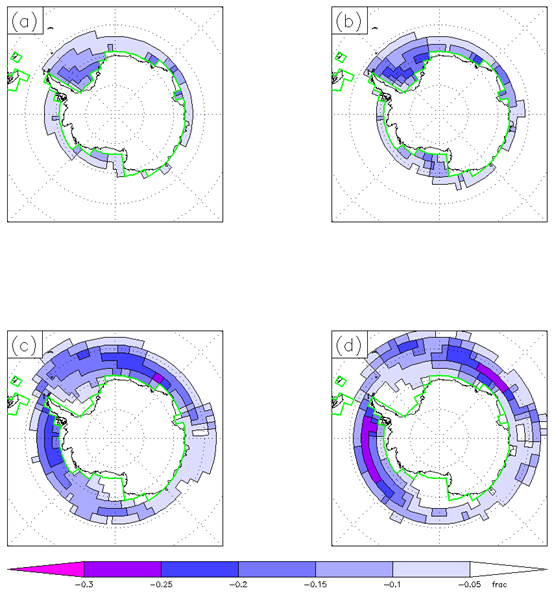
Twenty First Century sea ice concentration change for (a) DJF, (b) MAM, (c) JJA and (d) SON, showing the difference between the 2080-2099 mean and 2004-2023 mean. Changes are shown in terms of the fraction of the surface covered by sea ice, rather than sea ice percentage, since a spatial plot of sea ice percentage change would show infinite (or very large) increases where concentrations were initially zero (or very small).
File history
Click on a date/time to view the file as it appeared at that time.
| Date/Time | Thumbnail | Dimensions | User | Comment | |
|---|---|---|---|---|---|
| current | 15:31, 6 August 2014 | | 554 × 593 (171 KB) | Maintenance script (Talk) | Uploaded by import script |
- You cannot overwrite this file.
File usage
The following page links to this file: