File:Figure 5.12 - Observations and predictions of average ozone mass deficit and maximum ozone hole area.png
From ACCE
Size of this preview: 481 × 767 pixels. Other resolution: 520 × 829 pixels.
Original file (520 × 829 pixels, file size: 237 KB, MIME type: image/png)
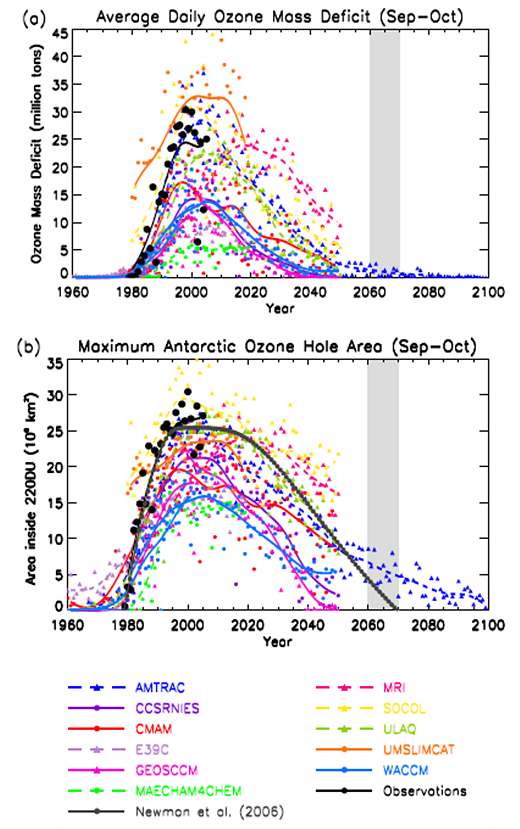
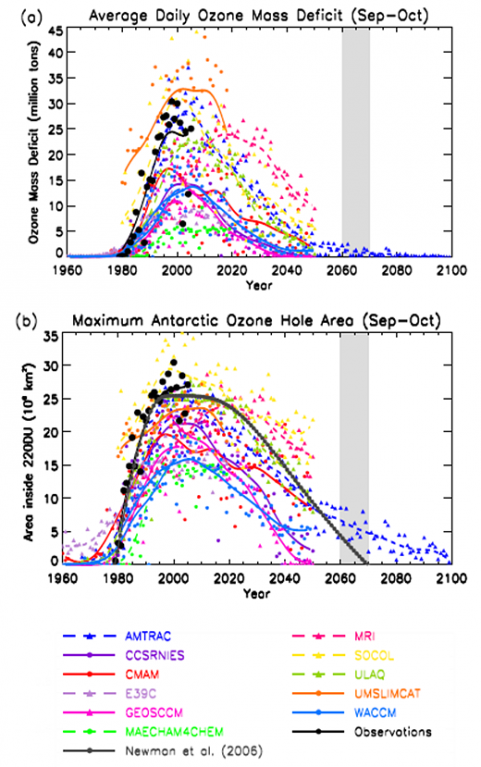
(a) September to October average daily ozone mass deficit, and (b) the maximum ozone hole area, for each year from each model. Curves, shading and source of observations are as in Figure 5.11. Adapted from WMO (2007[1]).
- ↑ WMO, 2007. Scientific Assessment of Ozone Depletion: 2006, World Meteorological Organisation Global Ozone Research and Monitoring Project – Report No. 50, Geneva, Switzerland (2007).
File history
Click on a date/time to view the file as it appeared at that time.
| Date/Time | Thumbnail | Dimensions | User | Comment | |
|---|---|---|---|---|---|
| current | 15:31, 6 August 2014 | | 520 × 829 (237 KB) | Maintenance script (Talk) | Uploaded by import script |
- You cannot overwrite this file.
File usage
The following page links to this file: