File:Figure 4.5 - Schematic summary of interannual variations in SST, sea level pressure and sea ice extent.png
From ACCE
No higher resolution available.
Figure_4.5_-_Schematic_summary_of_interannual_variations_in_SST,_sea_level_pressure_and_sea_ice_extent.png (554 × 254 pixels, file size: 220 KB, MIME type: image/png)
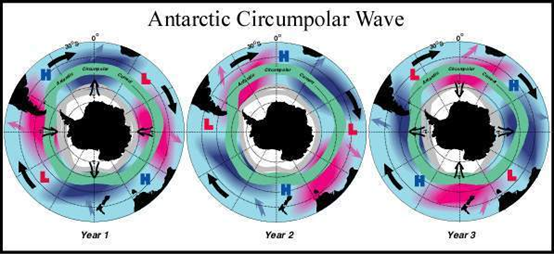
Simplified schematic summary of interannual variations in sea surface temperature (red, warm; blue, cold), atmospheric sea level pressure (bold H (high) and L (low)), and sea ice extent (grey line), together with the mean course of the Antarctic Circumpolar Current (green). Heavy black arrows depict the general eastward motion of the anomalies, and other arrows indicate communications between the circumpolar current and more northerly tropical gyres (White and Peterson, 1996[1]).
- ↑ White, W.B. and Peterson, R. 1996. An Antarctic Circumpolar Wave in surface pressure, wind, temperature, and sea ice extent, Nature, 380, 699-702.
File history
Click on a date/time to view the file as it appeared at that time.
| Date/Time | Thumbnail | Dimensions | User | Comment | |
|---|---|---|---|---|---|
| current | 15:31, 6 August 2014 | | 554 × 254 (220 KB) | Maintenance script (Talk) | Uploaded by import script |
- You cannot overwrite this file.
File usage
The following page links to this file: