File:Figure 4.56 - Annual mean uptake of air-sea CO2 fluxes as calculated from OPA-PISCES 1990-1999.png
From ACCE
No higher resolution available.
Figure_4.56_-_Annual_mean_uptake_of_air-sea_CO2_fluxes_as_calculated_from_OPA-PISCES_1990-1999.png (522 × 299 pixels, file size: 218 KB, MIME type: image/png)
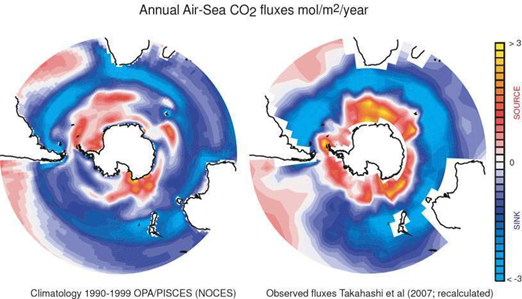
Annual mean uptake of air-sea CO2 fluxes as calculated from OPA/PISCES 1990-1999 (Lenton et al., 2006[1]) and that from the new climatology of Takahashi et al. (2009[2]). The sub-Antarctic region (40-50°S) represents a strong sink (blue colors), whereas south of 50°S, large regions act as a CO2 source for the atmosphere (red).
- ↑ Lenton, A., Metzl, N., Aumont, O., Lo Monaco, C. and Rodgers, K. 2006. Simulating the Ocean Carbon Cycle: A focus on the Southern Ocean. Presented at Second CARBOOCEAN Annual Meeting, 4-8 Dec 2006, Maspalomas, Spain.
- ↑ Takahashi, T., Sutherland, S.C., Wanninkhof, R., Sweeney, C., Feely, R.A., Chipman, D.W., Hales, B., Friederich, G., Chavez, F., Sabine, C., Watson, W., Bakker, D.C.E., Schuster, U., Metzl, N., Yoshikawa-Inoue, H., Masao Ishii, M., Midorikawa, T., Nojiri, Y., Kortzinger, A., Steinhoff, T., Hoppema, M., Olafsson, J., Thorarinn, S.., Arnarson, T.S., Tilbrook, B., Johannessen, T., Olsen, A., Bellerby, R., Wong, C.S., Delille, B., Bates, N.R. and De Baar, H.J.W. 2009. Climatological mean surface PCO2 and net CO2 flux over the global oceans, Deep Sea Research, doi:10.1016/dsr2.2008.12.009.
File history
Click on a date/time to view the file as it appeared at that time.
| Date/Time | Thumbnail | Dimensions | User | Comment | |
|---|---|---|---|---|---|
| current | 15:30, 6 August 2014 | | 522 × 299 (218 KB) | Maintenance script (Talk) | Uploaded by import script |
- You cannot overwrite this file.
File usage
The following page links to this file: