File:Figure 4.38 - Interpolated mean annual temperature and ice shelf loss due to climate-driven retreat.png
From ACCE
No higher resolution available.
Figure_4.38_-_Interpolated_mean_annual_temperature_and_ice_shelf_loss_due_to_climate-driven_retreat.png (360 × 552 pixels, file size: 169 KB, MIME type: image/png)
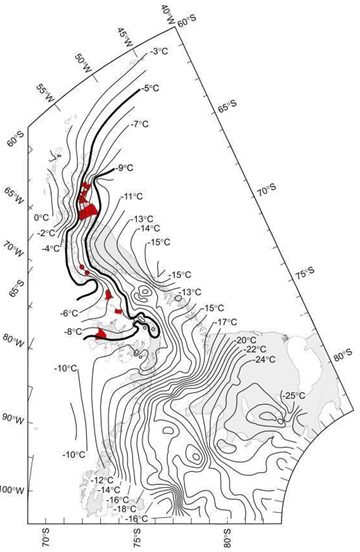
Contours of interpolated mean annual temperature. Currently existing ice shelves are shown in grey. Portions of ice shelves that have been lost through climate-driven retreat are shown in red (From Morris and Vaughan, 2003[1]).
- ↑ Morris, E.M. and Vaughan, D.G. 2003. Spatial and temporal variation of surface temperature on the Antarctic Peninsula and the limit of viability of ice shelves, In Antarctic Peninsula Climate Variability: Historical and Paleoenvironmental Perspectives. Antarctic Research Series, 79, edited by E. Domack, et al., 61-68, AGU, Washington, DC.
File history
Click on a date/time to view the file as it appeared at that time.
| Date/Time | Thumbnail | Dimensions | User | Comment | |
|---|---|---|---|---|---|
| current | 15:31, 6 August 2014 | | 360 × 552 (169 KB) | Maintenance script (Talk) | Uploaded by import script |
- You cannot overwrite this file.
File usage
The following page links to this file: