File:Figure 4.29 - Average monthly ice edge location during the whaling period and from satellite data.png
From ACCE
No higher resolution available.
Figure_4.29_-_Average_monthly_ice_edge_location_during_the_whaling_period_and_from_satellite_data.png (432 × 594 pixels, file size: 499 KB, MIME type: image/png)
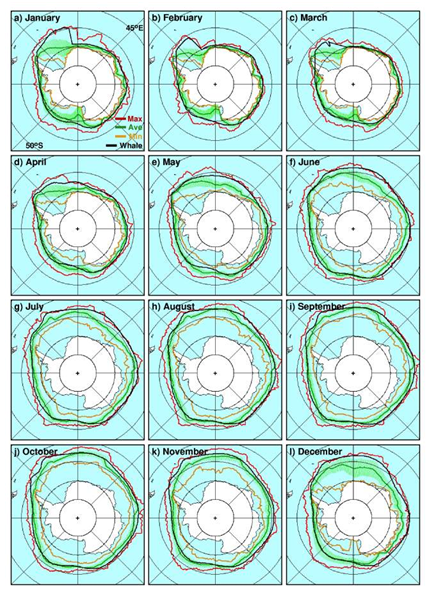
Average monthly location of the ice edge during the whaling period (1930s to 1940s) as compiled by MacKintosh (black), and as derived from satellite data for the period 1978 to 2007 (dark green). The standard deviation of the ice edge along different longitudes separated by one degree is shown in green, while the most northern and most southern locations are represented in red and gold, respectively. (Note: MacKintosh digital data was provided by P. Wadhams in 2001).
File history
Click on a date/time to view the file as it appeared at that time.
| Date/Time | Thumbnail | Dimensions | User | Comment | |
|---|---|---|---|---|---|
| current | 15:31, 6 August 2014 | | 432 × 594 (499 KB) | Maintenance script (Talk) | Uploaded by import script |
- You cannot overwrite this file.
File usage
The following page links to this file: